Answer the question
In order to leave comments, you need to log in
Axes customization in highcharts.js?
Good day everyone! It is required to build a graph according to the layout. I chose the highcharts.js plugin, which visually helps to get into what is on the layout very well, but I still can’t find the rules for customizing the axes. If someone worked in a similar way, I will be glad for a hint, the documentation was silent, or I don’t see what’s before my eyes :(
Answer the question
In order to leave comments, you need to log in
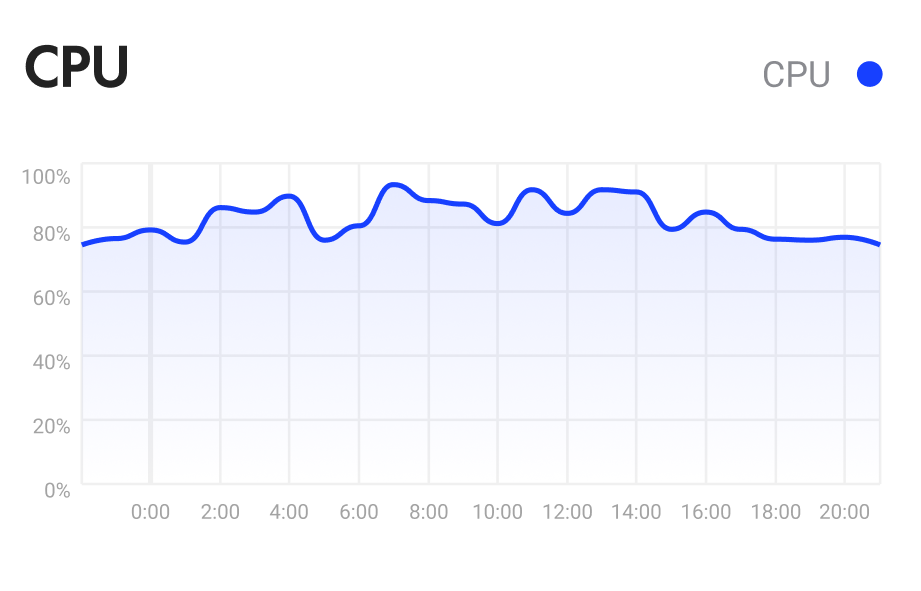
Here is the config that I managed to generate to get the same result as in the screenshot above. Maximum possible match.
Highcharts.chart('highcharts', {
    chart: {
        height: (9 / 16 * 100) + '%',
        type: 'areaspline',
        color: {
            linearGradient: {
                x1: 0,
                x2: 0,
                y1: 0,
                y2: 1
            },
            stops: [
                [0, 'rgba(23, 64, 255, 0.1)'],
                [1, 'rgba(23, 64, 255, 0']
            ]
        },
        style: {
            fontFamily: 'Roboto, sans-serif',
        },
        marker: {
            enabled: false
        },
        enableMouseTracking: false,
        legend: {
            enable: false
        },
        color: {
            linearGradient: {
                x1: 0,
                x2: 0,
                y1: 0,
                y2: 1
            },
            stops: [
                [0, 'rgba(23, 64, 255, 0.1)'],
                [1, 'rgba(23, 64, 255, 0']
            ]
        },
    },

    title: {
        text: null,
        align: 'left',
        style: {
            fontFamily: 'Roboto, sans-serif',
            fontSize: '16px',
            fontWeight: 'bold'
        }
    },
    tooltip: {
        enabled: false
    },
    credits: {
        enabled: false
    },
    yAxis: {
        min: 0,
        max: 100,
        title: false,
        tickInterval: 20,
        legend: {
            enabled: false
        },
        labels: {
            formatter() {
                return this.value + "%"
            }
        }
    },
    xAxis: {
        type: 'datetime',
        title: false,
        gridLineWidth: 1,
        showEmpty: true,
        legend: false,
        dateTimeLabelFormats: {
            day: {
                main: '%H %M'
            },
        },
        tickInterval: 7200 * 1000,
    },
    lineColor: '#1740FF',
    lineWidth: 3,
    plotOptions: {
        area: {
            fillColor: {
                linearGradient: {
                    x1: 0,
                    y1: 0,
                    x2: 0,
                    y2: 1
                },
                stops: [
                    [
                        0,
                        'rgba(23, 64, 255, 0.1)'
                    ],
                    [
                        1,
                        'rgba(23, 64, 255, 0)'
                    ]
                ]
            },
            lineColor: '#1740FF',
            lineWidth: 3,
            states: {
                hover: {
                    enabled: false
                }
            },
        }
    },
    series: [{
        lineColor: '#1740FF',
        lineWidth: 3,
        showInLegend: false,
        type: 'areaspline',
        marker: {
            enabled: false
        },
        enableMouseTracking: false,
        legend: {
            enable: false
        },
        color: {
            linearGradient: {
                x1: 0,
                x2: 0,
                y1: 0,
                y2: 1
            },
            stops: [
                [0, 'rgba(23, 64, 255, 0.1)'],
                [1, 'rgba(23, 64, 255, 0']
            ]
        },
        data: [
            [new Date('2017-01-03T00:00:00Z').getTime(), 20],
            [new Date('2017-01-03T02:00:00Z').getTime(), 50],
            [new Date('2017-01-03T02:30:00Z').getTime(), 80],
            [new Date('2017-01-03T02:35:00Z').getTime(), 70],
            [new Date('2017-01-03T03:35:00Z').getTime(), 60],
            [new Date('2017-01-03T03:36:00Z').getTime(), 20],
            [new Date('2017-01-03T04:34:00Z').getTime(), 50],
            [new Date('2017-01-03T04:55:00Z').getTime(), 80],
            [new Date('2017-01-03T05:35:00Z').getTime(), 70],
            [new Date('2017-01-03T05:55:00Z').getTime(), 60],
            [new Date('2017-01-03T06:00:00Z').getTime(), 20],
            [new Date('2017-01-03T06:56:00Z').getTime(), 50],
            [new Date('2017-01-03T07:30:00Z').getTime(), 80],
            [new Date('2017-01-03T07:45:00Z').getTime(), 70],
            [new Date('2017-01-03T08:35:00Z').getTime(), 60],
            [new Date('2017-01-03T09:36:00Z').getTime(), 20],
            [new Date('2017-01-03T10:34:00Z').getTime(), 50],
            [new Date('2017-01-03T11:55:00Z').getTime(), 80],
            [new Date('2017-01-03T12:35:00Z').getTime(), 70],
            [new Date('2017-01-03T14:55:00Z').getTime(), 60],
            [new Date('2017-01-03T16:55:00Z').getTime(), 60],
            [new Date('2017-01-03T18:55:00Z').getTime(), 60],
            [new Date('2017-01-03T20:00:00Z').getTime(), 60]
        ]
    }]

});Didn't find what you were looking for?
Ask your questionAsk a Question
731 491 924 answers to any question