Answer the question
In order to leave comments, you need to log in
And what are the algorithms for finding the maximum accumulation of points on the plane?
There is a plane (~2000x2000 in size), on which points (an array of points) with coordinates [x, y] are scattered. It is known that there is definitely a maximum accumulation. He must be found. The array of points is known.
The only thing that came to mind was to scan the entire plane with a window and see how many points fell into it. Where most of all - there is a cluster.
But I'm definitely not the first to encounter such a problem, and maybe there are other, more "fast" and well-tuned algorithms?
UPD
A cluster of dots is… uh… a cluster of dots… A place where the density of dots is maximum.
For example, this is what happens if the resulting array is displayed graphically: The
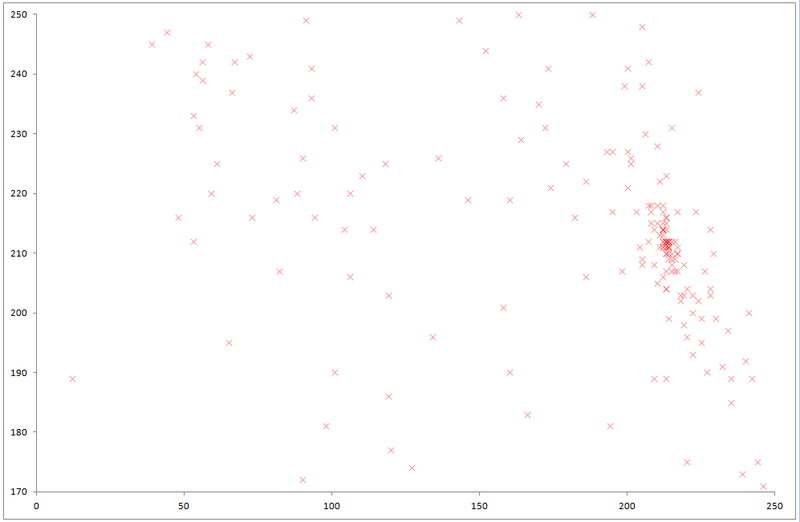
maximum is visible to the naked eye.
Are there any fast algorithms for finding it?
Answer the question
In order to leave comments, you need to log in
IMHO, for this task, where the goal is not completely clear. If there is AC area in width, 1-3 in height.
Walk the vector-scanner along the width A(1-3), B(1-3), C(1-3), and understand at what mark the most points, then also walk along the height 1(AC), 2(AC ), 3(AC) also get a mark where the cluster of points is denser. well, the intersection of 2 of these marks will be the place of maximum accumulation.
By the way, if you don't like graphical heuristics, there is an even better way.
Namely, to calculate the checkmate. the expectation and variance of your list of points. This will take linear time and the required area will most likely be a circle centered on the mat. expectation and radius to the root of the variance.
I’m not sure that such a setting will always work - it may turn out to be too large a spread, but the obvious plus will be the linear running time. And complex crawling-box tricks can be used as a fallback method in case of large variance.
This task came across to me many times. In different dimensions (from 1 to 6, and the six-dimensional space was not Cartesian at all - it described the movements of three-dimensional space) and with a different number of points, but always without an exact formulation. It seems that I never wrote a good solution, each time I waved my hand and went the other way. But the thoughts are the following.
1) without the concept of "scale" the task does not make sense. That is, before solving it, you need to ask yourself a certain “window size”, “point blur radius”, “gray zone width”, etc.
2) most often this size is not known in advance. If you take it with a margin, then the result will be plausible, but inaccurate, and if the size is too small, then on the contrary, there will be a local accumulation among the void. It is probably best to choose a decreasing sequence r1>r2>r3>r4… (for example, for a window of 2000x2000 this can be a power of two from 128 to 8), find a square with side r1 containing the maximum number of points, it contains a square with side r2, etc. In this case, our result will be plausible over the entire range of scales.
3) It makes no sense to search for the boundaries of squares with an accuracy of up to a pixel. If we are looking for an NxN square, then it suffices to iterate over the squares with a step of N/4 for each coordinate. For example, if we are looking for a 128x128 square on a 2000x2000 plane, then it is enough to consider 3600 possible positions of this square (the vertex has coordinates from 0 to 1888 with a step of 32). Get an integer array of this size. Each point falls into 16 squares (or less) - increase 16 cells by 1. Find the maximum - it will give the starting square.
After that, in this square, sort out 25 squares 64x64, in the maximum of them 25 squares 32x32, etc.
If r1 is chosen too small, and the plane was too large, then instead of an array (which was 60x60), you can use some kind of tree (to save memory and initialization time).
It is possible that it makes sense to look at more than one sequence of squares, but several (choose 10 squares of size r1 with the largest weight, from all squares with side r2 lying in them - 10 largest, etc.) But this will be more difficult to write, and it will work only if the cluster is not clearly expressed, but somewhere there is a rarefied nebula. However, in this situation it is necessary to immediately decrease r1.
Just scale down your entire field by a factor of 10-100, rounding point coordinates to an integer, then iterate over the reduced field and find which field coordinate has the most points. If there are several such coordinates, compare these areas in the original size.
The solution will become clearer if you decide on the problem. I don’t really understand what a cluster of points is, and even a maximum one.
1) There are many options: a square with side A that has more points in it than in any other square with the same side.
2) The same, only with a circle and a radius.
3) A point of the plane such that the sum of the distances to all given points is minimal.
And this is just a glimpse.
There are different solutions for different tasks.
To find this cluster, it is enough to apply a color averaging filter to the picture. It will erase all the lonely dots, and leave a spot, and even blur it, removing the noise. Finding a spot is easy, there are many algorithms ready to use. But what will you do if there is no obvious stain?
In <a href="habrahabr.ru/blogs/image_processing/134352/> similar task, I just used the median averaging.
As mentioned above, if we calculate the standard deviation (but not from the average, but from the median), with great reliability (the more points, the better), we get something like a center of gravity, around which in a circle with a radius σ there will be the largest number points.
Another option: as suggested above. Those. convert these points into an image, sampling with a large step. Having found the "pixel" with the highest intensity (number of points), go to a smaller sampling. A variation on the dichotomy.
There is another option: construct around the points convex non-intersecting hulls of maximum area containing exactly one point each. The distribution function of the area of shells from the coordinates will give the concept of the distribution of the density of points. But this problem is difficult mathematically, and it is hardly necessary to complicate it so much when the previous methods will fit perfectly.
I think this answer will suit you:
stackoverflow.com/questions/356035/algorithm-for-detecting-clusters-of-dots
We divide the array into two quadrangles, count in each one in which there is more, again divide by two, count, again divide by 2 count, and so on as many times as necessary until there is a quadrangle of the required accuracy. Ideally, you need to reach 1 point, and from it already make a square, circle or the desired shape, the desired size.
I remember back at the university they were busy with these dots. I don’t remember the algorithm now, but we calculated the distances between the points and determined the scattered ones using it. I don’t remember the purpose of the task, but I can find out if you remind me tomorrow afternoon.
Try playing around with DBSCAN . If you set the density parameter in it sufficiently large, then the algorithm will most likely find exactly one cluster in your array - the desired cluster of points.
With plane dimensions of 2000x2000, in most cases it is quite possible to get by with a complete enumeration of your algorithm (only ~ 4 million options). Moreover, the algorithm can be greatly accelerated if the window is shifted by several units at once. For example, if you shift the window by 5 units (points), then there will be only 160,000 options.
With large amounts of data, you can come up with an iterative algorithm with decreasing window and shift sizes.
Use something similar to the "K nearest neighbors" algorithm. Roughly speaking, for each point, calculate the distances to the k nearest neighbors, and whoever has the sum of these distances is less, those points are closer to the epicenter :) This way you can find a bunch of "central" points.
If you do this dynamic programming, it will not work very slowly
Is the probabilistic algorithm not suitable for you?
Namely: if there are k points out of n in the expected window, we select a random point as the desired one, consider the windows containing it.
The probability that in m attempts you will not find the correct answer is ((nk)/n)^m.
The first thing that came to mind was to first take the square (0,0) - (width, height) and then somehow shift the boundaries.
The second is to number the points through recursion: for each unlabeled point, f(i) = label the point with number i and call itself for all unlabeled points located at a distance < L from the point. So we mark with numbers all groups of points within which the points are located from each other no further than the distance L.
Well, then you need to calculate which number has the most points (or you can immediately count).
Replace points with circles (choose the radius to taste): enter an additional plane on which to draw circles. Draw circles not with color, but with a counter - if the zone is covered 1 time, then enter “1”, if 2 times, then “2”.
It's almost like "smearing the dots with a graphic filter".
And then, from an additional plane, shoot the finished results in the form of cells with the maximum number of overlaps. Or by detecting the edges of an image by a certain brightness, if we talk in terms of graphical algorithms.
We have already written about the K-means method above, I think you should take any of the well-known clustering methods, there are others besides K-means
k-means algorithm.
works something like this:
https://media1.giphy.com/media/12vVAGkaqHUqCQ/sour...
Didn't find what you were looking for?
Ask your questionAsk a Question
731 491 924 answers to any question