Answer the question
In order to leave comments, you need to log in
Why is the graph incorrect in Zabbix 5?
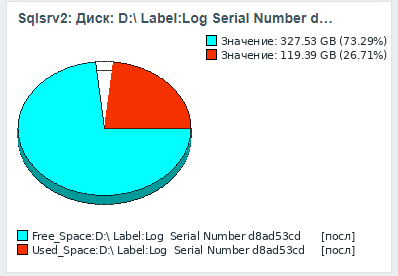
There was a need for pie charts and then a problem surfaced. Two components of the graph, which are 100%, but there is a third component. Where is she from?
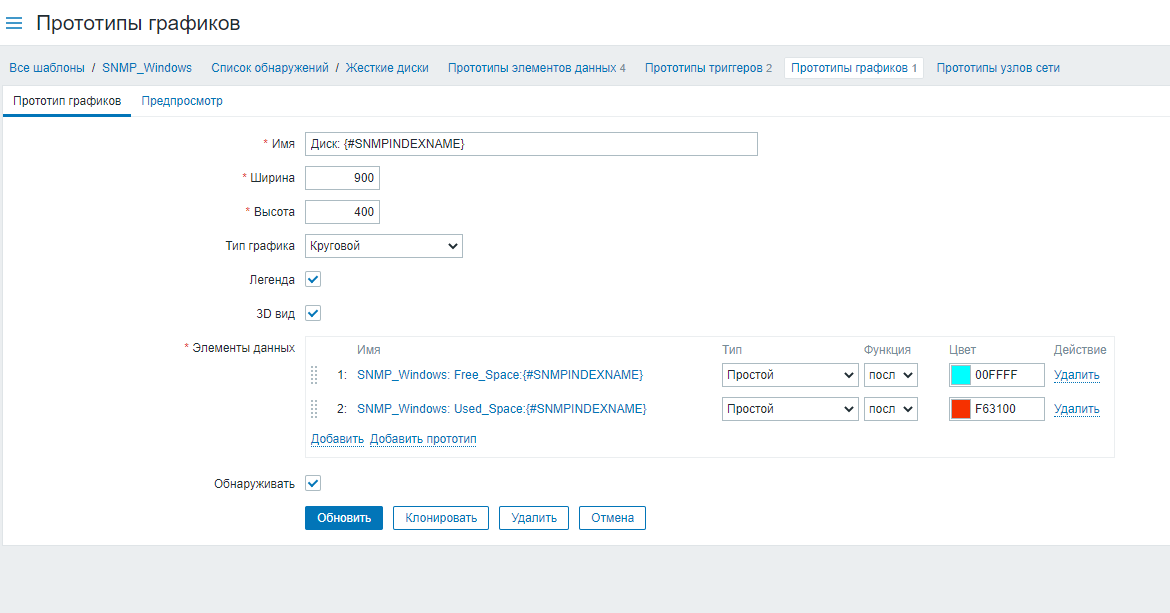
Here is the data for the investigation:
Zabbix 5.0.5

Here I also changed the type of element No. 2 to summary. No changes
Here is the graph itself

This is a special case, for the most part the graph is built correctly (95% of cases).
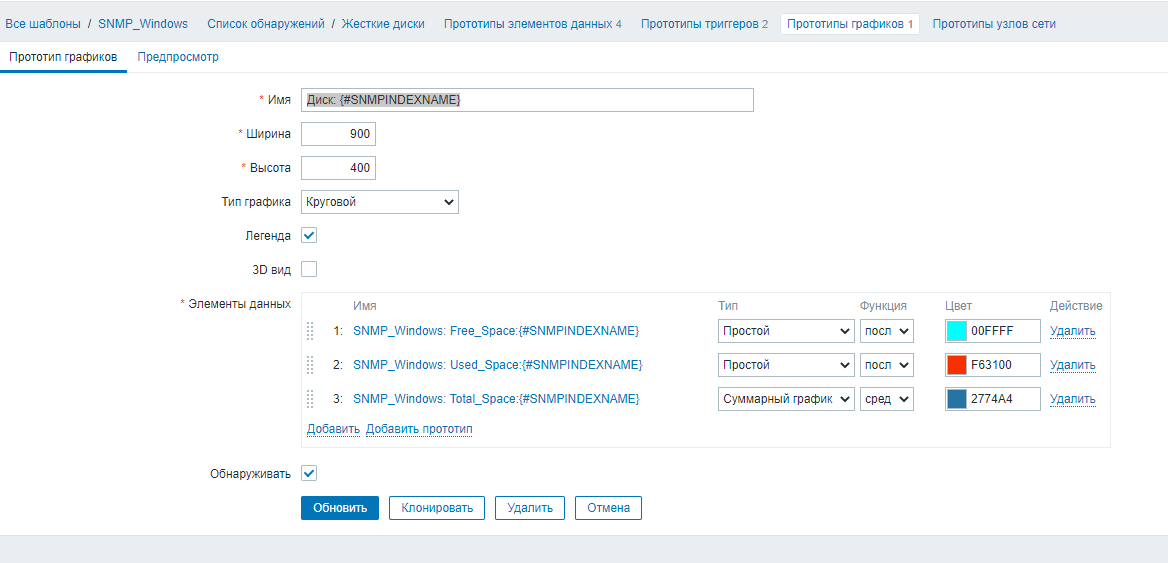
There is also a second question. I upgraded the graph, most likely wrong, but here's what happened:

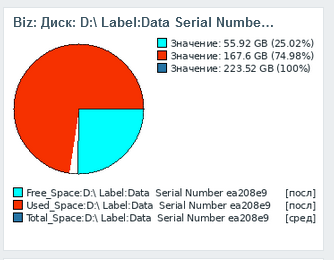
Here's what happened:

Do I understand correctly that the third element is under the first two? That is, a graph of 200%?
Answer the question
In order to leave comments, you need to log in
Didn't find what you were looking for?
Ask your questionAsk a Question
731 491 924 answers to any question