V
V
vityaba32020-09-23 09:28:48
Python
vityaba3, 2020-09-23 09:28:48

Why is PyPlot drawing bullshit?

Code like this:

import matplotlib.pyplot as plt
import numpy as np

A = [[i for i in line.split()] for line in open('1.TXT')] # Читаем данные
A = np.array(A)                                                        # Делаем их numpy типом
Wl, I = (A[:,0]) , (A[:,1])                                             # Мне нужны Wl (Как абсцисса, I, как ордината)
A = None                                                                # А это мне не нужно (такой странный способ импорта 
                                                                               # я давно использую. Лень переписывать
plt.plot(Wl, I)                                                           # Рисуем
plt.show()


Data

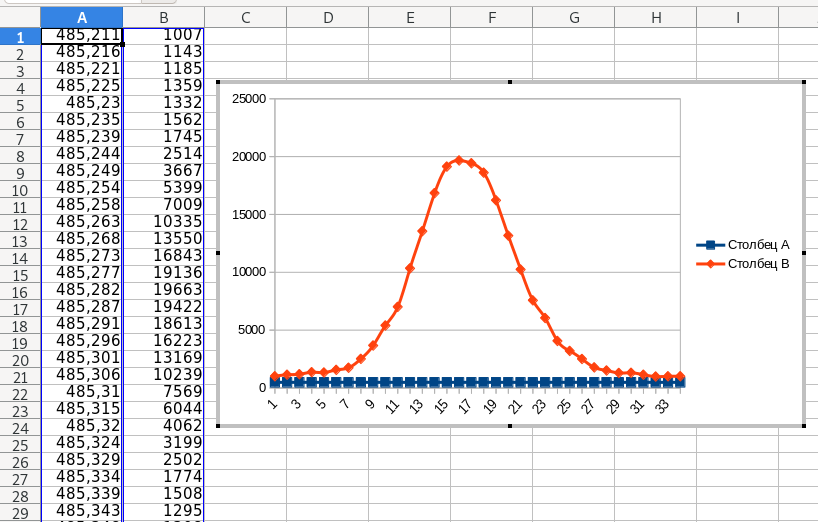
485,211 1007
485,216 1143
485,221 1185
485,225 1359
485,23 1332
485,235 1562
485,239 1745
485,244 2514
485,249 3667
485,254 5399
485,258 7009
485,263 10335
485,268 13550
485,273 16843
485,277 19136
485,282 19663
485,287 19422
485,291 18613
485,296 16223
485,301 13169
485,306 10239
485,31 7569
485,315 6044
485,32 4062
485,324 3199
485,329 2502
485,334 1774
485,339 1508
485,343 1295
485,348 1308
485,353 1143
485,358 984
485,362 1003
485,367 1007


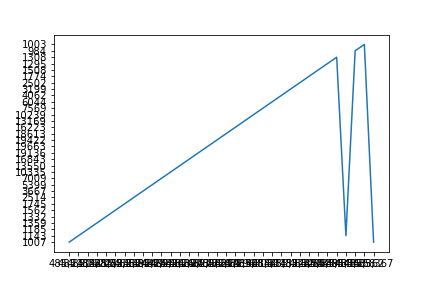
Result in Python and Excel

s5ci4l6gttekqbrwbieiuniw8zs.png

drfveuginwrqqls7zmdvn2ta-is.png


What's happening?

Answer the question

In order to leave comments, you need to log in

[[+comments_count]] answer(s)
V
vityaba3, 2020-09-23
@vityaba3

Because the input was UNICODE CHARACTERS, not numbers.
Need like this:

A = [[i for i in line.split()] for line in open('1.TXT')]
A = np.array(A, dtype=np.float64)                       # !!!
Wl = (A[:,0])
I = (A[:,1])

plt.plot(Wl, I)

And in the file, replace all commas with dots.
5f6af015e528d821413975.png

Didn't find what you were looking for?

Ask your question

Ask a Question

731 491 924 answers to any question