Answer the question
In order to leave comments, you need to log in
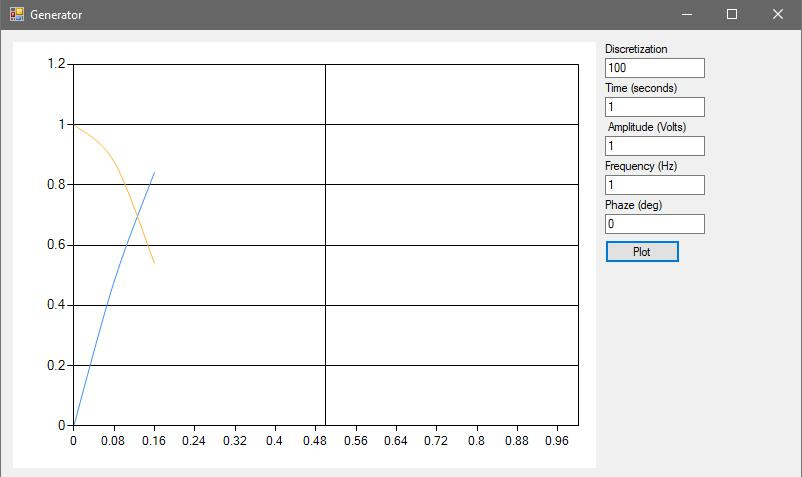
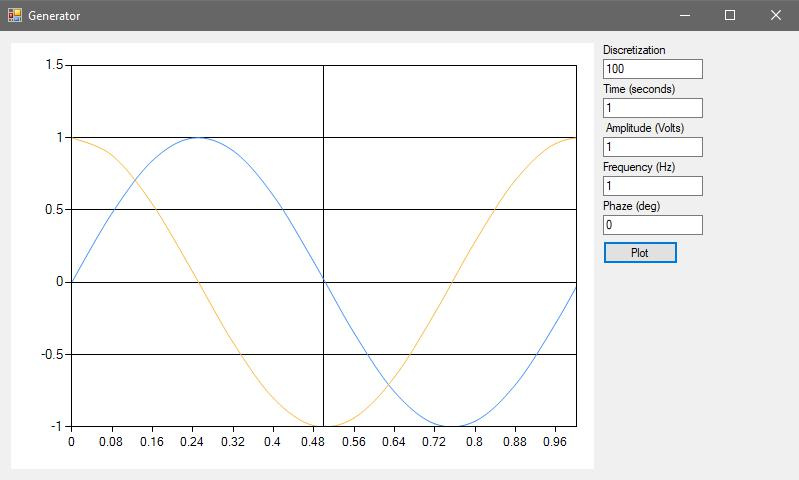
Why does WinForms draw graphs strangely, depending on the maximum value of x?
Good day)
I wrote a program for plotting a sine and cosine graph and ran into such a delicate problem:
the Chart component behaves very strangely, if you do not multiply the variable that is responsible for the maximum value on the x-axis by 2pi
"Wool" StackOverflow - and nothing I didn't find it... I
'm attaching the code:
private void buttonPlot_Click(object sender, EventArgs e)
        {
            double xMin = 0;
            double xMax = double.Parse(textBoxTime.Text) * 6.28;
            int discretization = int.Parse(textBoxDiscretization.Text);
            double time = double.Parse(textBoxTime.Text);
            double deltaT = Math.Round((double)discretization / (double)time);
            int amplitude = int.Parse(textBoxAmplitude.Text);
            double frequency = double.Parse(textBoxFrequency.Text);
            double phase = ConvertToRadians(double.Parse(textBoxPhase.Text));
            double step = 0.5;

            int plotPointsCount = (int)(Math.Ceiling((xMax - xMin)) / step) + 1;

            double[] x = new double[plotPointsCount];
            double[] ySin = new double[plotPointsCount];
            double[] yCos = new double[plotPointsCount];

            for (int i = 0; i < plotPointsCount; i++)

            {
                x[i] = xMin + step * i;
                ySin[i] = amplitude * Math.Sin(x[i] + (2 * Math.PI * frequency * deltaT + phase));
                yCos[i] = amplitude * Math.Cos(x[i] + (2 * Math.PI * frequency * deltaT + phase));
                x[i] = x[i] / 6.25;

            }

            chart1.ChartAreas[0].AxisX.Minimum = xMin;
            chart1.ChartAreas[0].AxisX.Maximum = xMax / 6.28;
            chart1.ChartAreas[0].AxisX.MajorGrid.Interval = step;

            chart1.Series[0].Points.DataBindXY(x, ySin);
            chart1.Series[1].Points.DataBindXY(x, yCos);
        }
Answer the question
In order to leave comments, you need to log in
Didn't find what you were looking for?
Ask your questionAsk a Question
731 491 924 answers to any question