Answer the question
In order to leave comments, you need to log in
Who worked with charts?
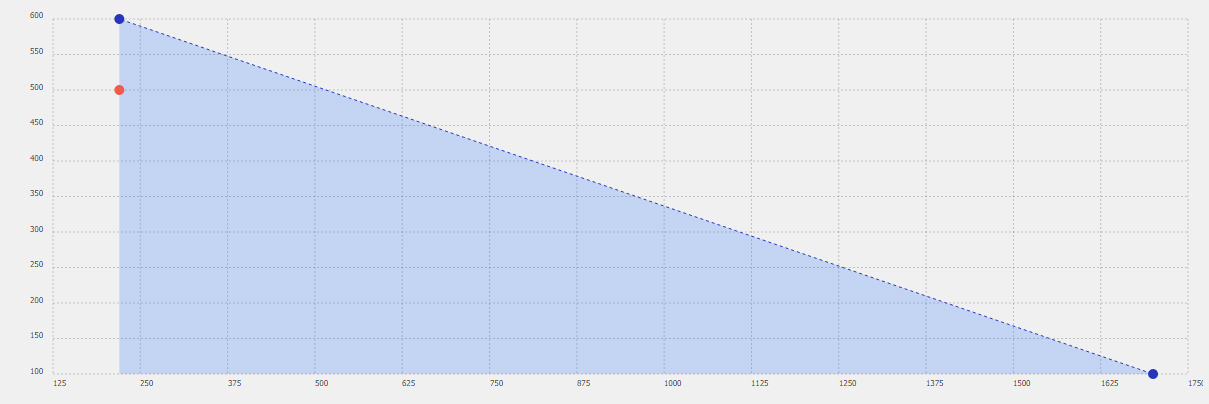
Hello! I work for a company that sells ventilation equipment, in particular industrial fans, and now I'm working on a fan selection program. The program works, but there is a problem, the problem is that my program draws straight lines, my program draws such a graph:

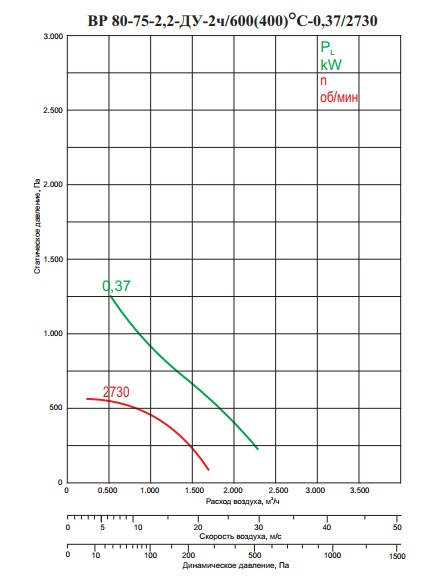
In the catalog, this line of an identical fan is slightly curved

: and draws a line, this line is straight.
I'm wondering why this line is curved (arc-shaped)? Of course, I can make this line of the curve stupidly put the third point on the graph and fit it to the graph from the magazine, but I want it to be wise and as it should be!
The people who faced such a task? Is there a calculation formula?
In the company where I work, I can’t explain anything intelligibly to me, they say it should be a curve and that’s it!
Answer the question
In order to leave comments, you need to log in
Didn't find what you were looking for?
Ask your questionAsk a Question
731 491 924 answers to any question