Answer the question
In order to leave comments, you need to log in
What will help display the names of the regions in RStudio?
In general, the code with which I work.
library(maptools)
setwd("C:/kaz/gadm")
map.kz <- rgdal::readOGR("gadm34_KAZ_1.shp") #использую шейп-файлы
slotNames(map.kz)
[email protected]
str([email protected])
[email protected]$NAME_1
spplot(map.kz,
       "NAME_1",
       scales = list(draw = T),
       col.regions = heat.colors(n = 16) )
[email protected]$Persent <- c(88.9, 72.4, 83.7, 75.0,  #тут данные статистики
                         78.7, 75.0, 75.6, 84.9,
                         74.3, 87.8, 79.4, 77.1,
                         81.9, 73.2)

mypalette <- colorRampPalette(c("purple", "white")) #настроила цвет для хороплета
mypalette
function (n)
{
  x <- ramp(seq.int(0, 1, length.out = n))
  rgb(x[, 1L], x[, 2L], x[, 3L], maxColorValue = 255)
}
spplot(map.kz, "Persent",
       col.regions = mypalette(20),
       col = "transparent",
       par.settings = list(axis.line = list(col = NA)))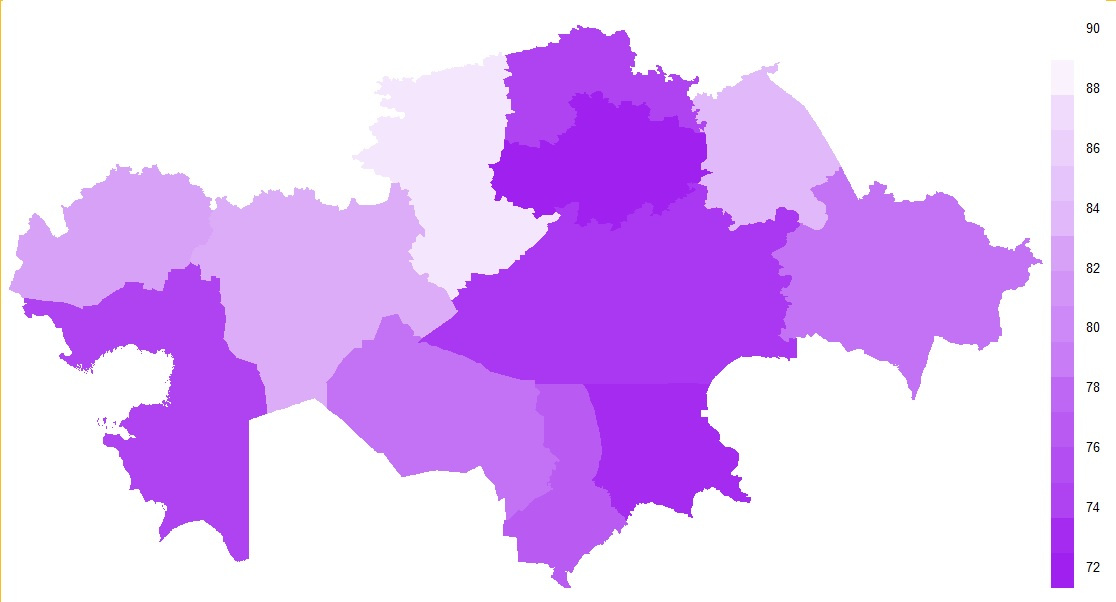
Answer the question
In order to leave comments, you need to log in
Didn't find what you were looking for?
Ask your questionAsk a Question
731 491 924 answers to any question