Answer the question
In order to leave comments, you need to log in
What program do you use to plot graphs?
Hello!
You need to draw graphs like this: 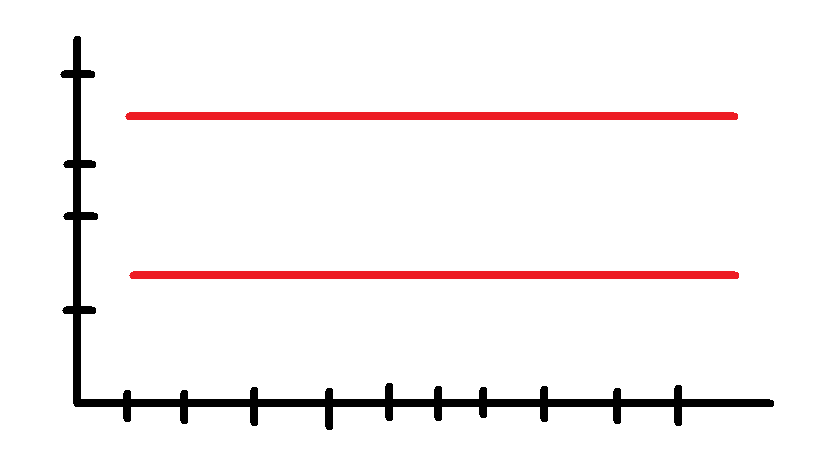
On the Y axis there will be numerical values, on the X - dates.
The red lines are the area of normal values, that is, if the graph is in this area, everything is in order, if not, then no.
I would like to know in which program this can be better and easier to implement?
Answer the question
In order to leave comments, you need to log in
Didn't find what you were looking for?
Ask your questionAsk a Question
731 491 924 answers to any question