Answer the question
In order to leave comments, you need to log in
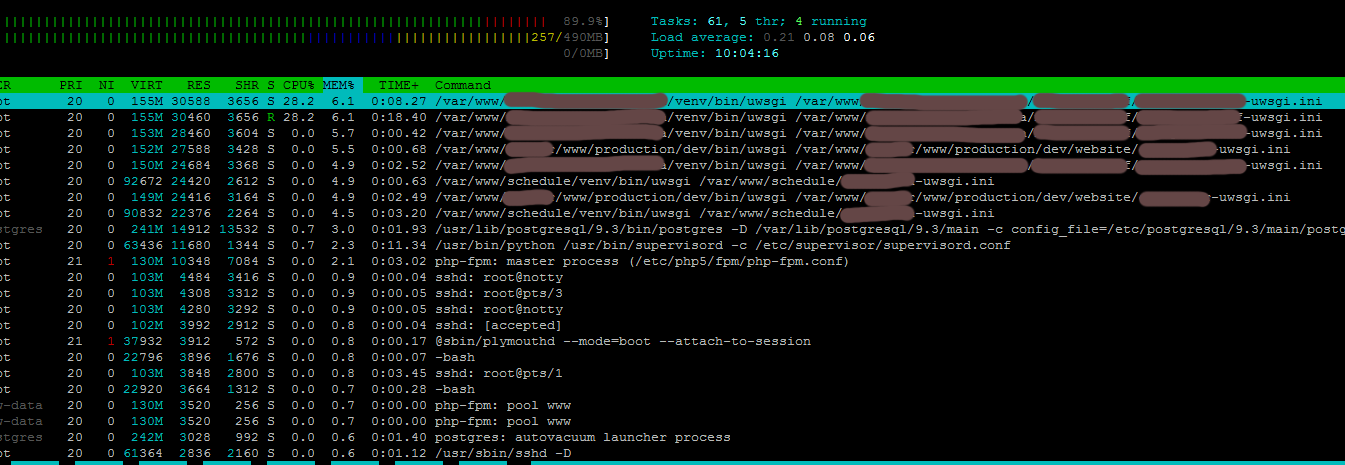
What is the reason that PostgreSQL uses a lot of CPU?
There is a site on Django, database, respectively, a little less than 100 visitors per day, digitalocean hosting vps (515). I can’t understand for what reason PostgreSQL loads the processor so much, and this happens as if by accumulating something, now the server has rebooted and when I go to the htop site it shows a load of 1-3%, before the reboot it was 40+% for one call. Since the site used to crash because of this (PostgreSQL ran out of memory and it turned off), I made the settings recommended by pgtune , the site does not crash, but hangs wildly.
In the PostgreSQL logs, it is clear that there is not enough memory, but I can’t figure out where it goes and why.
2015-12-09 12:28:40 EST LOG: could not fork autovacuum worker process: Cannot allocate memory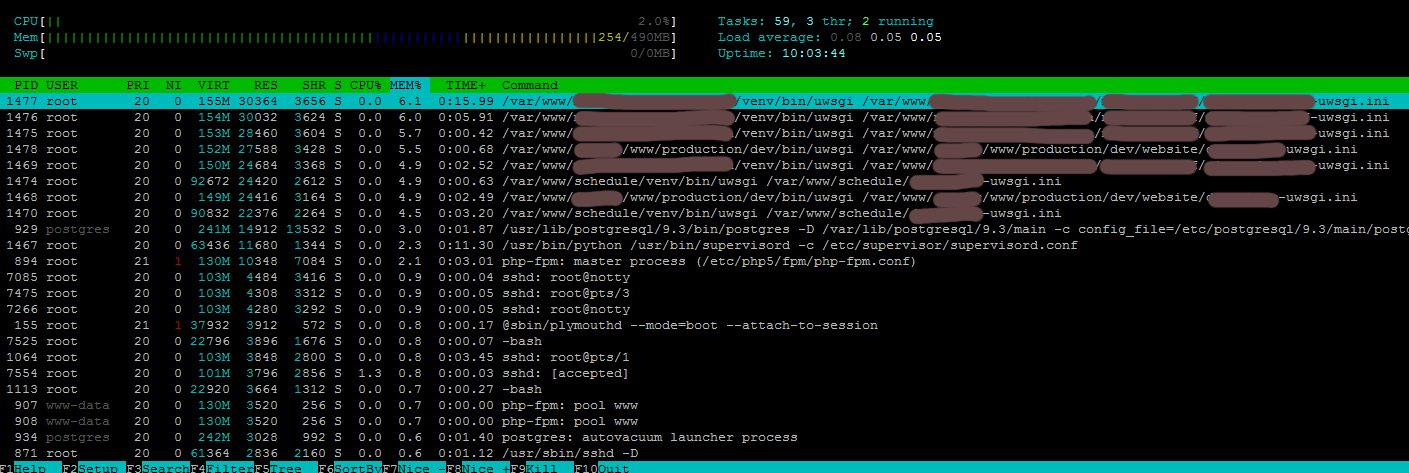
Transactions:                   1000 hits
Availability:                 100.00 %
Elapsed time:                  88.91 secs
Data transferred:               5.10 MB
Response time:                  0.09 secs
Transaction rate:              11.25 trans/sec
Throughput:                     0.06 MB/sec
Concurrency:                    1.00
Successful transactions:        1000
Failed transactions:               0
Longest transaction:            0.60
Shortest transaction: 0.06max_connections = 100
shared_buffers = 128GB
effective_cache_size = 384GB
work_mem = 1342177kB
maintenance_work_mem = 2GB
checkpoint_segments = 32
checkpoint_completion_target = 0.7
wal_buffers = 16MB
default_statistics_target = 100Answer the question
In order to leave comments, you need to log in
well, here it will be possible to poke a finger into the sky for a long time
1. load on the screw? check. swapping
2. the presence of keys in the fields
3. find who "eats" memory
postgres settings lay out what you have there in memory / disk / cpu?
give pg_stat_bgwriter and pg_stat_database
Проблема явно в коде или преждевременной бездумной оптимизации настроек бд. У меня есть аналогичный(Django+Postres9.1) проект на DO и ни разу похожих проблем не было за несколько лет.
Еще вариант что вас взломали и запустили какого-то зловреда нагружающего систему. В любом случае без логов, топа, конфигов определить что там у вас не так сложно.
у вас поди самый мелкий дроплет и нет свапа, а в постгресе много данных и ему не хватает памяти автовакуумнуться.
Можно посмотреть в сторону large_page в sysctl, конфиг postgres.conf с его оптимизацией и разумеется VACUUM.
1. Замените GB на MB в параметрах и измените work_mem, чтобы стало так:
shared_buffers = 128MB
effective_cache_size = 384MB
work_mem = 4MB
maintenance_work_mem = 32MBDidn't find what you were looking for?
Ask your questionAsk a Question
731 491 924 answers to any question