Answer the question
In order to leave comments, you need to log in
What is the correct name for this type of diagram and how to draw it in Java / Scala?
This is shootout. There is a series of measurements and the chart shows, as I understand it, 5%, 25%, 50%, 75% and 95% percentiles (also, if you look closely, you can notice the highs and lows with the letter T): 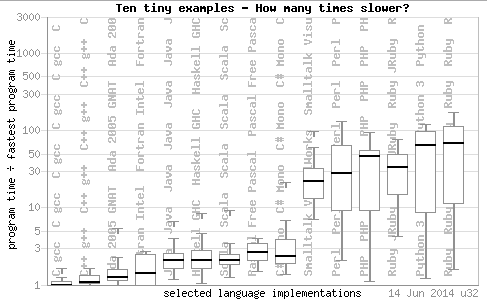
Looks like candlesticks ( candlestick in JFreeChart ), but candles are completely different. They show the maximum, minimum, the beginning of the series, the end of the series and plus color - whether it is an increase or a fall.
So, there are two questions.
(1) What is the correct name for this type of chart?
(2) How can this be drawn in Java or Scala?
Answer the question
In order to leave comments, you need to log in
Didn't find what you were looking for?
Ask your questionAsk a Question
731 491 924 answers to any question