Answer the question
In order to leave comments, you need to log in
What filter should be used for the XYZ plot?
Hello, I have a question about filtering a 3d graph with noise and emissions.
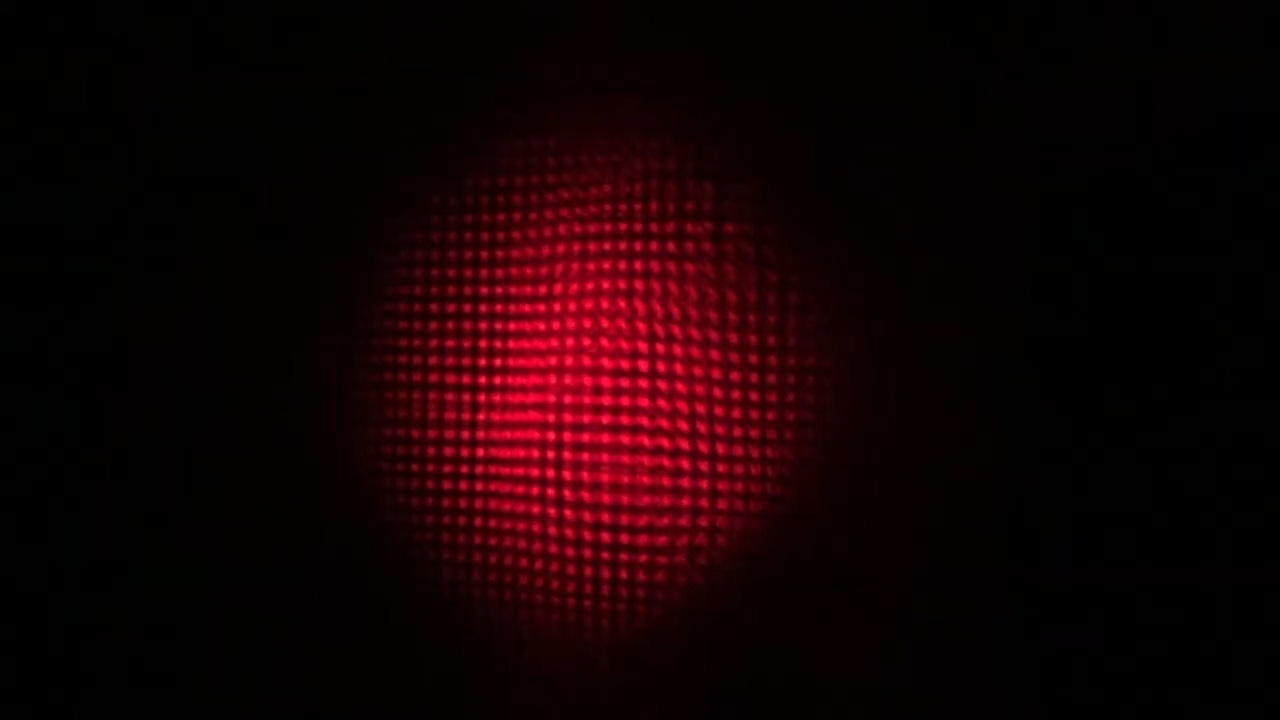
There is an image where you need to know the coordinates of the red dots, but they can be very close.
Or
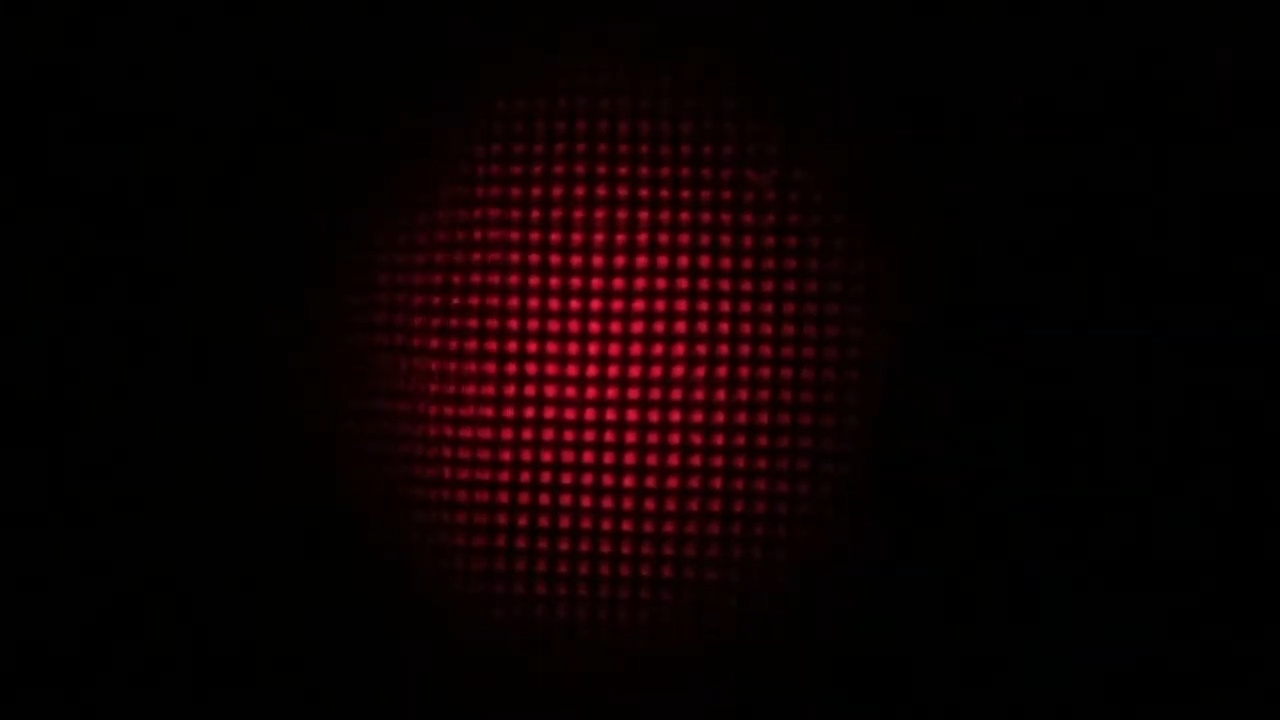
I decided to start with a double array of values for how much each point (pixel) is close to red.
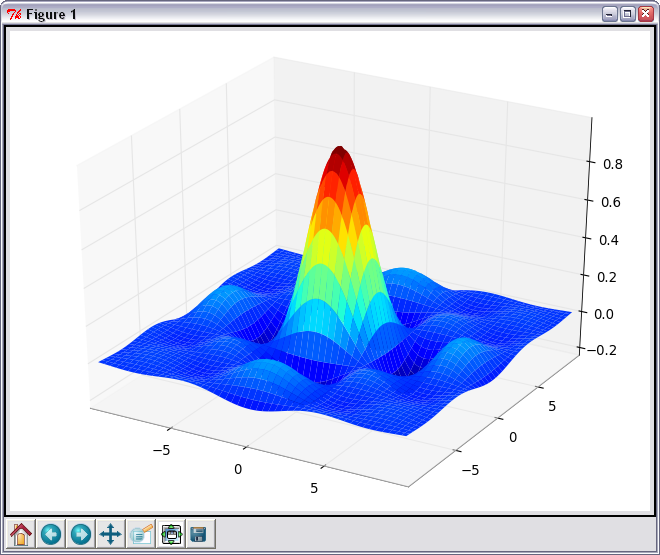
And I got a 3d graph that looks like this in a section.
As an example.
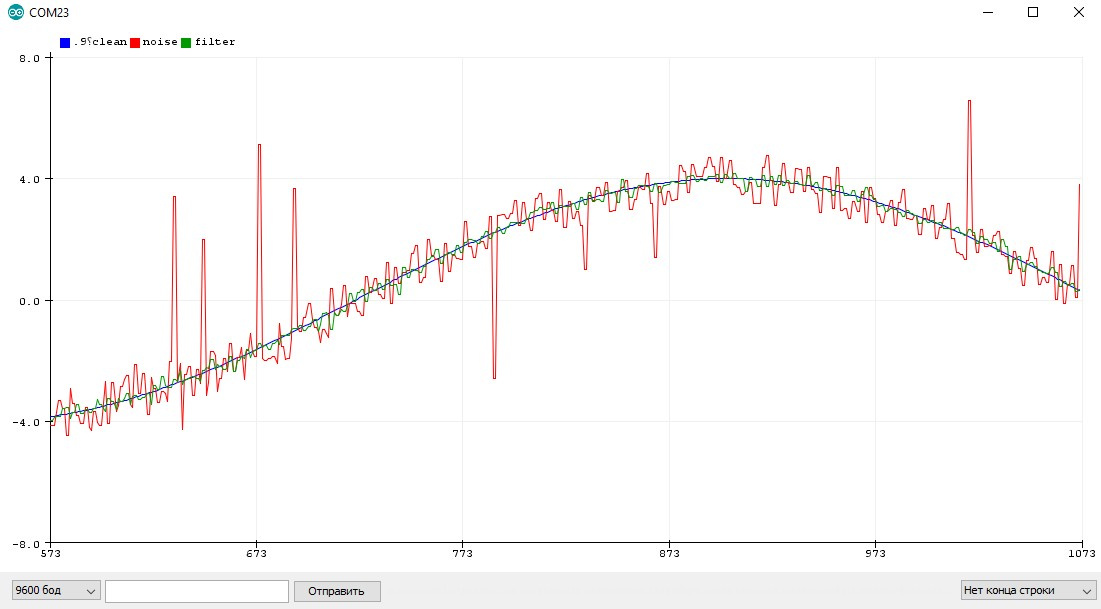
What filter do I need to apply so that as a result the graph looks like smoothed peaks. So that I could determine the coordinates of the heights from the vertices.
Like something like this.
Thanks in advance for your constructive response.
Answer the question
In order to leave comments, you need to log in
The simplest thing is to process the neighborhoods of each of the points, and then take either the average, or the average with the extreme values \u200b\u200bthrown out, or something else
Didn't find what you were looking for?
Ask your questionAsk a Question
731 491 924 answers to any question