Answer the question
In order to leave comments, you need to log in
What does pg_top show?
Most likely the question is simple, but I think you will help faster than I will look for myself, thanks in advance.
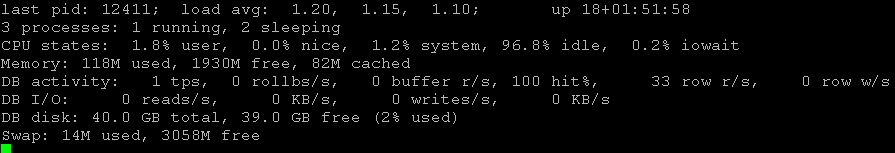
pg_top shows the following values:
0 buffer r/s,
100 hit%,
Can you tell me what these values are and how they change? The fact that r / s is reading per second, w / s is writing (probably), but what are they measured in? What is hit?
I also see I/O (DB I/O: 0 reads/s, 0 KB/s ) - what is reads/s measured in?
Answer the question
In order to leave comments, you need to log in
Didn't find what you were looking for?
Ask your questionAsk a Question
731 491 924 answers to any question