Answer the question
In order to leave comments, you need to log in
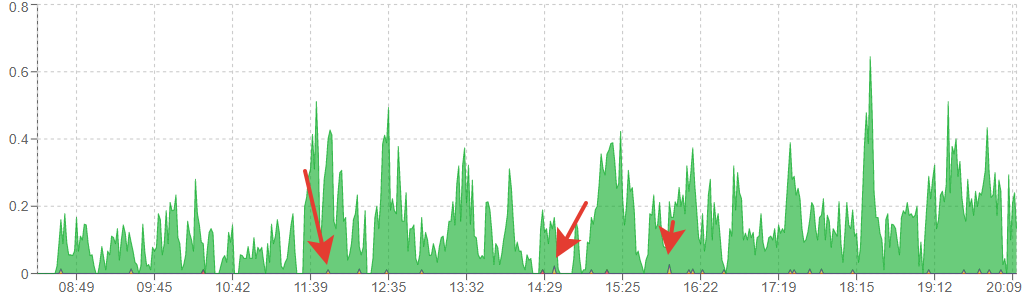
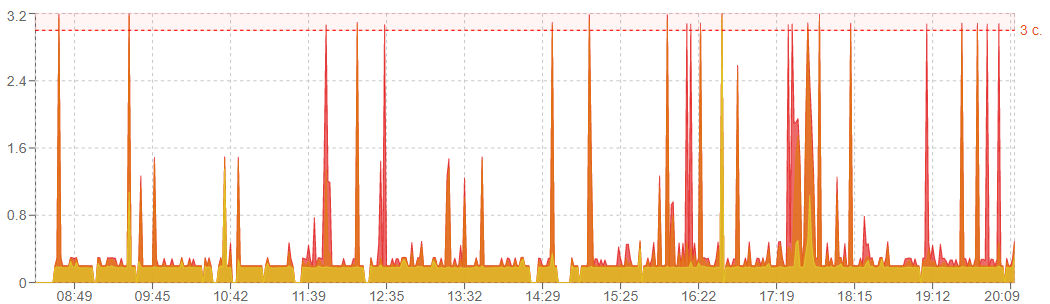
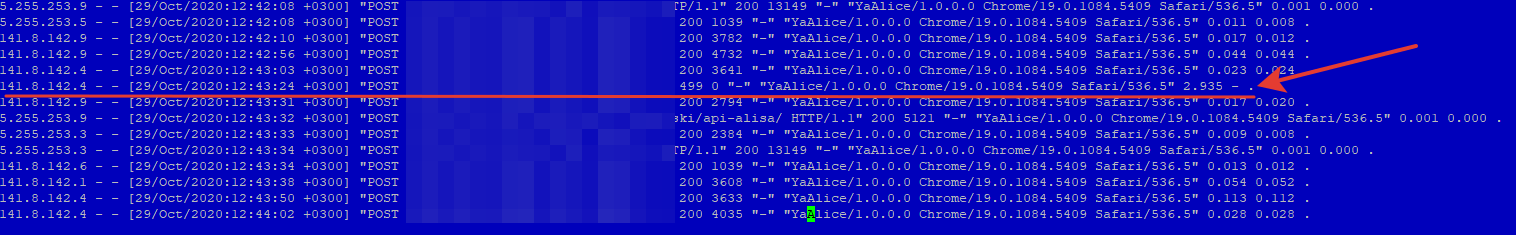
What causes jumps in request processing time?
Hello! What is:
Answer the question
In order to leave comments, you need to log in
1 . iotop -okaduring such friezes
2. switch the processor mode from energy save to performance cat /proc/cpuinfo | grep MHz all processors must have either the maximum frequency or close to it.
When the processor is "cold", it needs time to raise the frequency, and it turns out that it sometimes works faster under load than completely empty but with 800MHz
3. do not forget that php + sql can execute the same query at different speeds, moreover, this difference is nothing not in 1%, but sometimes it reaches 300% and is aggravated by the queue both in sql and at any stage.
4. I can tell you that by the way it is the most common
a) disk io, especially HDD (nvme), you can not even test.
b) sql parallelizes its queries but makes one query on 1 core, as a result, 128 core stone at 2Ghz can work slower than your office Corei3 because it has more cycle time per core.
c) php cache cache everything that is possible and competently, as a rule, in this place you can speed up every 10-30 times, without even optimizing queries in the database
d) find the heaviest queries in the database and optimize them.
Now what is most likely happening is
that you have a queue of requests to the database, for example, there is a heavy hit, let's say a directory with 5 filters, at this time the rest of the requests are queued, and even small ones are executed slowly because there is a heavy comrade in front of them.
So, for example, when 1 heavy request is made, 300 more have risen, and together they begin to climb and be executed.
The result is the same - the same as allocating 10,000 files in Windows to hdd and copying in parallel and not in series
IO sags many times, sometimes up to tens of thousands of times.
An example exaggerated but nonetheless.
As a result, you have a plug from scratch when LA system 5 IO 10% sql=100% on 1 stone.
As a rule, the situation further becomes more complicated according to the following scheme
, all the stones are engaged in heavy hits, the more it becomes easier each time, since the resources of other stones are already occupied, as a result, once a day the base starts to slow down, and it is restarted by the crown.
;)))
But everything is individual.
to all of the above, I’ll add that the load may not occur in the current task, but in parallel ones (for example, some resource-intensive process is running, like backup or indexing), incl. it is necessary to take into account the server load at the time of the task start.
server: 2 x 2.8 GHz, 4 GB RAM, 50 GB NVMe (13 GB filled)
Logging slow queries in the database is empty.
- Logging slow scripts in php-fpm - empty.
Didn't find what you were looking for?
Ask your questionAsk a Question
731 491 924 answers to any question