Answer the question
In order to leave comments, you need to log in
Testing a hypothesis on random (or unknown source) numerical data as a series. Organization question?

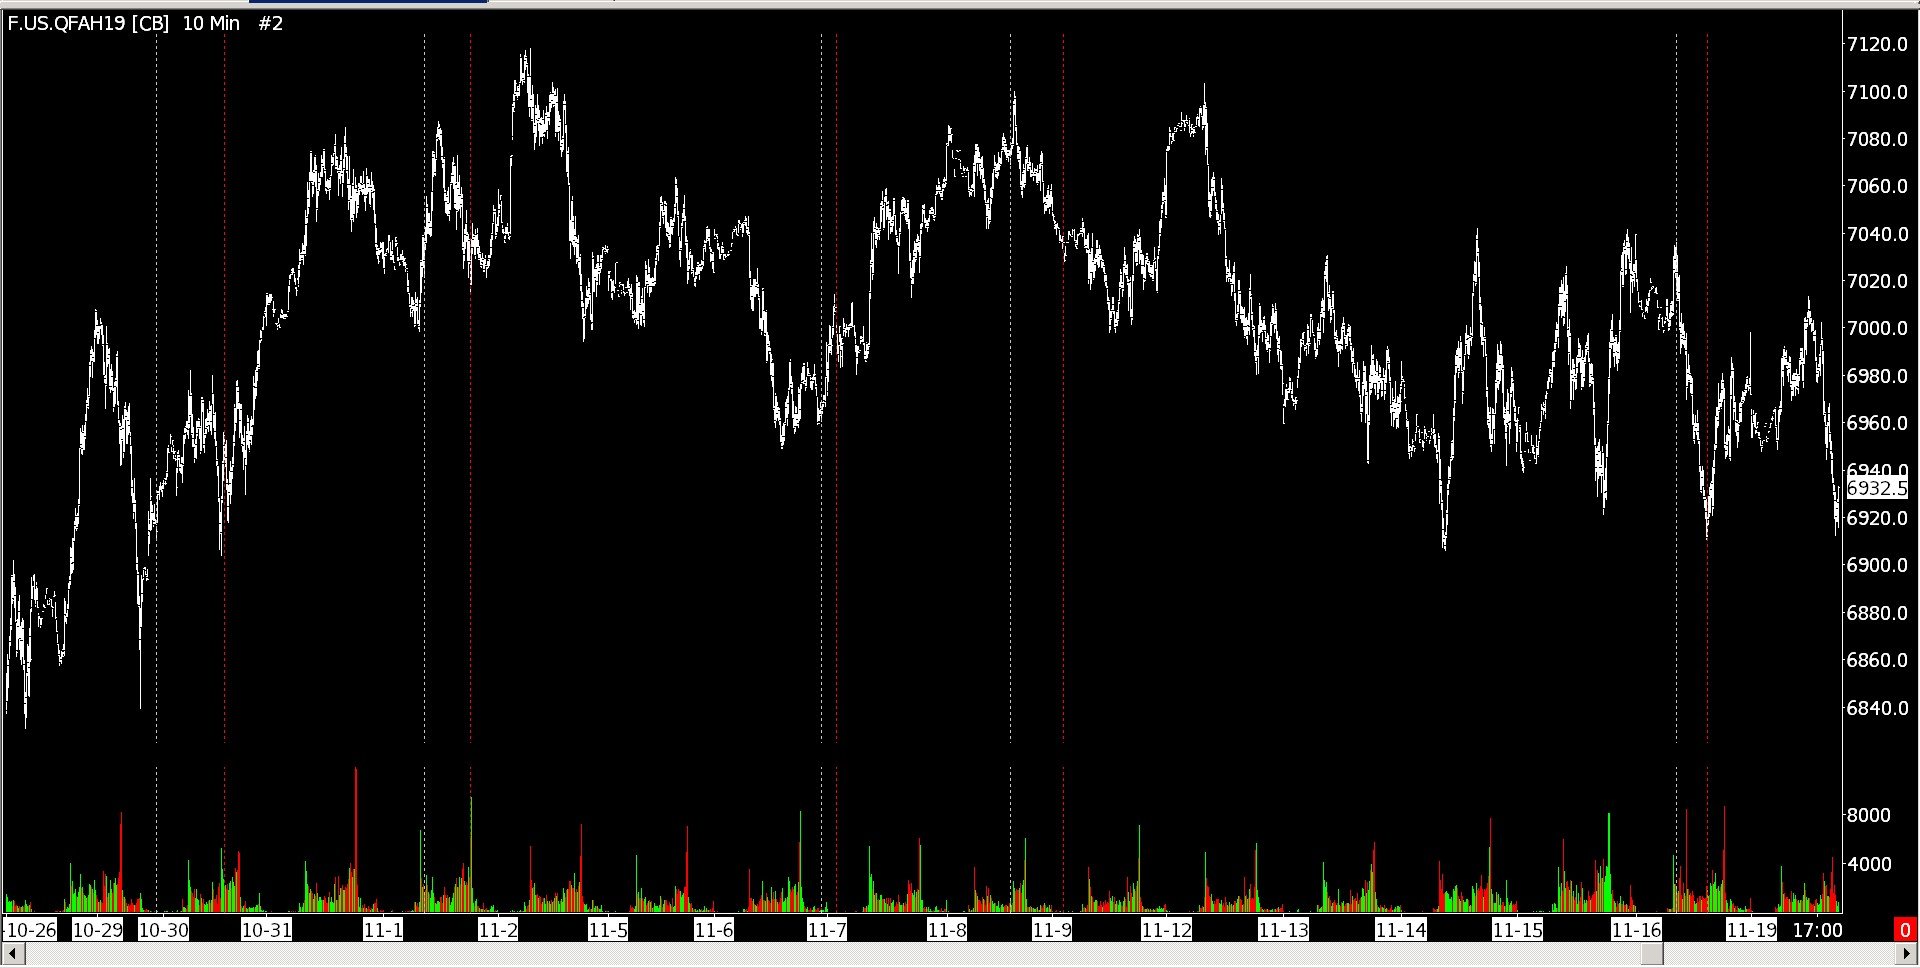
Hi all. This is an exchange price/volume data feed. I know that there is no grail, but I ask you to assume that I found it.
Vertical lines enter and exit a trade. They are generated from my own price/volume sequence. The sequences are always different and of different lengths, but visually I see some common "feature" in them.
For the purpose of automation, it is interesting to apply numerical methods to the marked data, about which my question is. Thank you.
Answer the question
In order to leave comments, you need to log in
you can write a simple random number generator from 0 to 100, and add random "up" and "down" to it, and then build a chart on the sequence of these data, then you will not distinguish it from the current trading chart.
I advise you not to waste your life in search of what is not.
You asked a strange question. why do you need the knowledge that the sequence is not random? Collect data, build a distribution, calculate its parameters .. everything is terver, these will be qualitative estimates of your data.
Do you want to check if your strategy is correct?
The simplest thing is to write a simple application that will emulate the operation of the exchange by quotes (or even by candlesticks, advice is to use the worst min/max cent option and don't forget about the broker/exchange commission).
Then implement your strategies and test them with this app and stock history. Of course, your strategy will have parameters, select them automatically (there are a lot of multidimensional optimization algorithms or blunt enumeration)
Depending on the strategy, those who are successful in tests may be successful in reality. This will allow you to test almost any of your hypotheses, as long as the volumes of your transactions are negligible relative to the volumes on the exchange.
For example, you can use the ready-made tester from mt4, as far as I remember, it can work with user historical data.
ps Why should the volume of transactions be small? because the market reacts to your trades and the stronger they are, the larger they are.
Didn't find what you were looking for?
Ask your questionAsk a Question
731 491 924 answers to any question