Answer the question
In order to leave comments, you need to log in
"Sticks" php fpm?
Good afternoon.
Faced a strange problem.
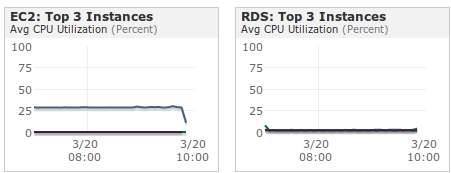
Given: Amazon EC2 server (m1.large instance: ~ 2x2.3GHz CPU, 7.5 Gb RAM), Debian 6.0 running on it and running nginx + php-fpm 5.3.9 (via Unix sockets). The settings for the highload were made both from the nginx/php side and from the system side. The load is small: 300+k hits, requests go mainly to simple functionality (this is a banner network), the base on a stand-alone RDS works without problems. The monitoring system from the newrelic.com service
PHP-FPM is screwed: it works in two pools. The second with an identical config.
listen = /tmp/php-fpm.sock
listen.backlog = -1
pm = dynamic
pm.max_children = 100
pm.start_servers = 30
pm.min_spare_servers = 20
pm.max_spare_servers = 50
pm.max_requests = 100

kernel: [235830.623812] hrtimer: interrupt took 46615898 ns
kernel: [236936.599597] php-fpm invoked oom-killer: gfp_mask=0x280da, order=0, oom_adj=0
kernel: [236936.599614] php-fpm cpuset=/ mems_allowed=0
kernel: [236936.599620] Pid: 25206, comm: php-fpm Not tainted 2.6.32-5-xen-amd64 #1
kernel: [236936.599625] Call Trace:
kernel: [236936.599637] []? oom_kill_process+0x7f/0x23f
kernel: [236936.599644] []? __out_of_memory+0x12a/0x141
kernel: [236936.599650] []? out_of_memory+0x140/0x172
kernel: [236936.599657] []? __alloc_pages_nodemask+0x4e5/0x5f5
kernel: [236936.599664] []? xen_mc_flush+0x159/0x185
kernel: [236936.599671] []? handle_mm_fault+0x27a/0x80f
kernel: [236936.599678] []? do_brk+0x227/0x301
kernel: [236936.599685] []? do_page_fault+0x2e0/0x2fc
kernel: [236936.599693] []? page_fault+0x25/0x30
Answer the question
In order to leave comments, you need to log in
Here someone in QA already asked why php 5.3 eats more RAM than 5.2. For now, as a temporary option, you can respawn in php-fpm after a few requests.
pm.max_requests = 500
I solved my problem, but I can't tell you the exact recipe. And all the same, the processes rested against the memory ceiling, though it happened so abruptly that the monitoring did not have time to show anything.
A set of all sorts of changes was made:
- php was made with a minimal set of modules
- removed the new-relic extension for monitoring the operation of php (there are suspicions that it could stick from it)
- the subd moved from Amazon RDS to regular EC2, which allowed finer tuning of the muscle
- was a request was identified that could slow down the work due to the large amount of transmitted data (option with business logic in php) or load the database (business logic on the subd) and, accordingly, the architecture was slightly redone to avoid these problems
So by and large this is a problem on the code side, rather, and on the server side, a little strange behavior when this problem occurs.
Put a script in cron that will collect logs on RAM consumption, it will not take more than half an hour to write it.
By the way, did you build PHP yourself or from dotdeb?
There is no decision?
A similar problem, similar settings and software, only a physical server. its own, 8GB and intel quad-core 2.8GHz.
Didn't find what you were looking for?
Ask your questionAsk a Question
731 491 924 answers to any question