Answer the question
In order to leave comments, you need to log in
Spectrogram audio python what to do?
I have python code
'''import sys, codecs
save_stdout = sys.stdout
sys.stdout = codecs.open("output.txt","w+")'''
import matplotlib.pyplot as plt
import scipy.io.wavfile
import numpy as np
Fs, X = scipy.io.wavfile.read('капля1.wav')
if isinstance(X[0], np.ndarray):  # стерео
        X = X.mean(1)
print(Fs, X.shape)
facecolor = '#D0ECE6'  # '#EDFAEA'
fig, axes = plt.subplots(figsize=(9, 4), facecolor=facecolor)
plt.xlabel('Время, c', fontsize='xx-large')
plt.ylabel('Частота, Гц', fontsize='xx-large')
# plt.title('Спектрограмма для колбы')
cmap = plt.get_cmap('magma')
try: T1, T2 = 15.03, 15.12  # (int(i) for i in input('Как обрезать?').split())
except: T1, T2 = 0, len(X)/Fs
t1, t2 = 1, 2  # (int(i) for i in input('Что выделить?').split())
plt.specgram(X[int(T1*Fs) : int(T2*Fs-len(X)) if len(X)!=T2*Fs else None], NFFT=64, pad_to=2048, mode='psd', Fs=Fs, noverlap=0,
             cmap=cmap)
# plt.colorbar(label='Уровень (дБ)', use_gridspec=False)
axes.add_artist(plt.Rectangle((t1-T1, 0), t2-t1, 100000, color='k', alpha=0.2))
axes.tick_params(labelsize='large', width=1)
fig.tight_layout()
plt.savefig('спектрограмма.png', facecolor=facecolor)
plt.show()
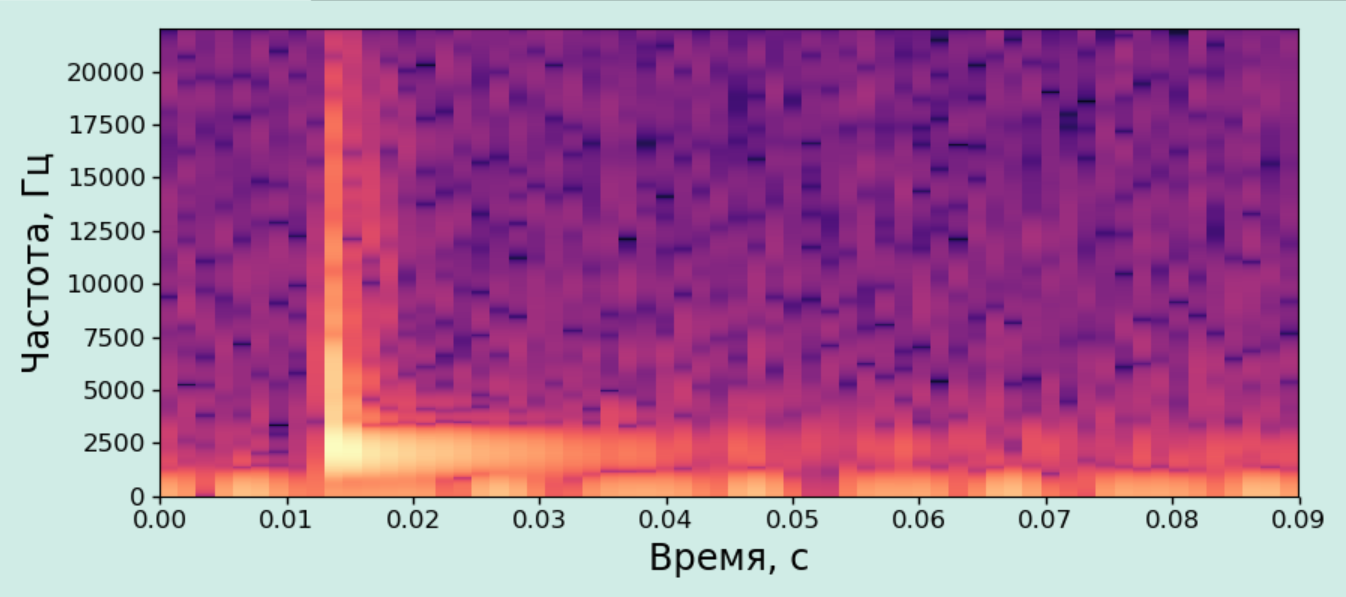
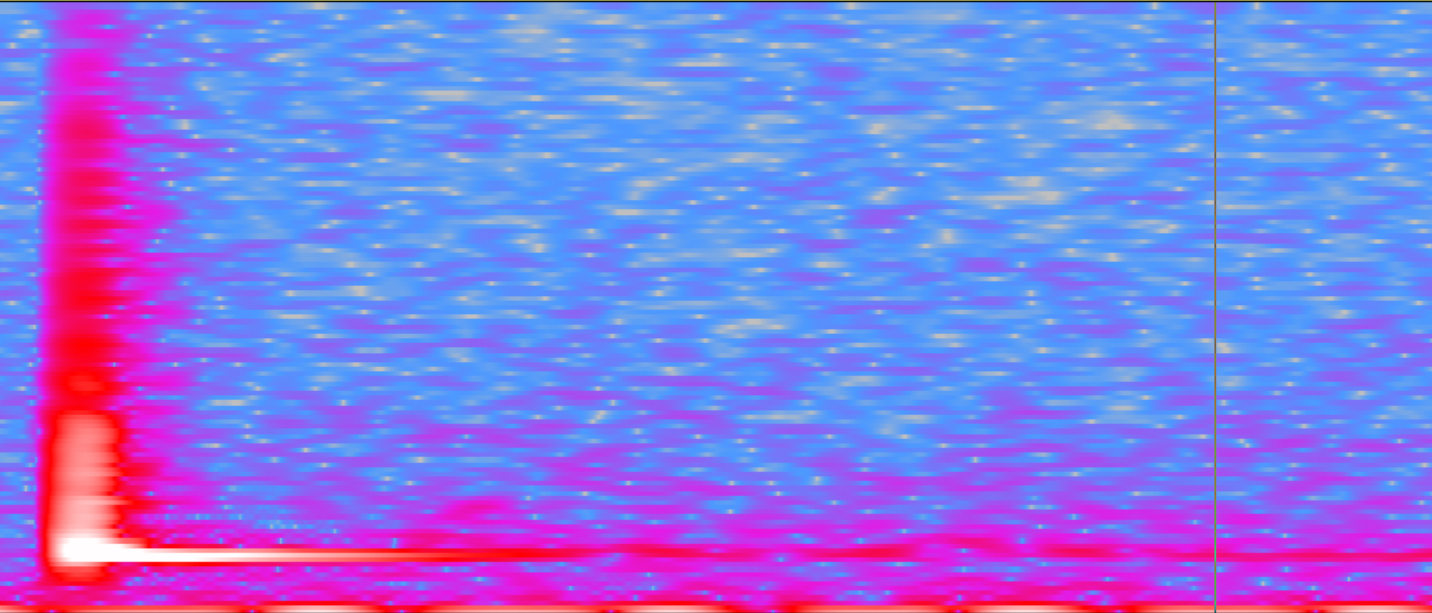
 Here you can see that Аudasity focuses on horizontal lines, and python - on vertical ones (sorry that I write in the language of a kindergarten, but I don’t know how to do it differently).
 Answer the question
In order to leave comments, you need to log in
I took Jose Portilla's Data Science course on udemy.com some time ago, where he gave a lot of examples of how to plot through MatplotLib and Seaborne.
If you don’t feel sorry for $10-15, then you won’t regret it, because he cites. the same graphs and explains all their ins and outs.
Here it is necessary to "play around" with the parameters. Or find out how it builds (parameters) its Аudasity.
why is NFFT=64, pad_to=2048, mode='psd', Fs=Fs, noverlap=0
instead of NFFT=256, pad_to=2048, mode='psd', Fs=Fs, noverlap=128
Spectrograms differ in window duration. In the example created with audasity, the analysis window is longer and, as a result, the frequency resolution is better. In the Python example, the window is shorter, the frequency resolution is worse, but the temporal resolution is better. Try to increase NFFT (window duration in reports), you will have to play with parameters in any case.
Didn't find what you were looking for?
Ask your questionAsk a Question
731 491 924 answers to any question