Answer the question
In order to leave comments, you need to log in
Python matplotlib how to scale synchronously on different plots of the same figure?
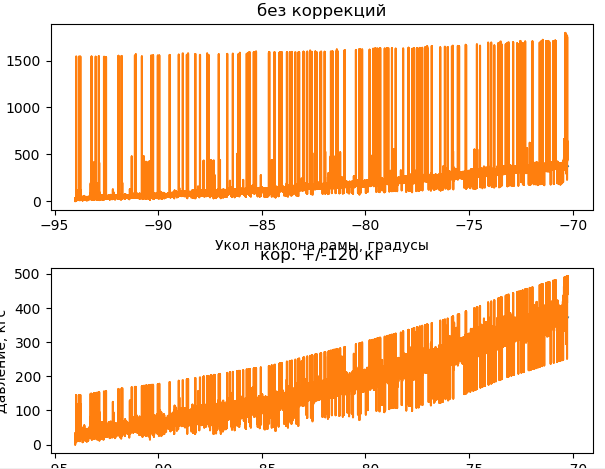
Hello, I'm recently using the matplotlib library. There was a need to analyze graphical data. There are several different data on the y-axis, and on the x-axis the data is 100% identical. Data is collected from different instruments at the same time. Then they are analyzed. And for the convenience of analysis, it is necessary to stretch the graph (zoom in) of a certain section along the X axis, simultaneously (synchronously) on two or more graphs, namely, stretch the same section along the X axis on other graphs automatically. How can I implement or maybe there are some other tools to do this?
Python 3.4.4, matplotlib 2.2.2 
Graphs like this, you need to simultaneously increase the
piece of code where I build graphs, but there is nothing ordinary here.
self.angle = []  # угол наклона рамы
        self.angle_r = []  # угол наклона ролика
        self.pressure = []  # задаваемое давление
        self.c_pressure = []  # текущее давление
        self.c_pressure0 = []
        self.speed_rolika = []  # текущая скорость ролика
        self.nn1 = []

# Пропускаю код обработки получиченных значений
# массивы данных пипа float

# строим выбранные графики
        k = 0
        fig = plt.figure()
        fig.add_subplot(111)
        if self.ui.checkBox.isChecked():
            k += 1
            subplot(int(str(n) + str(1) + str(k)))
            plot(self.angle, self.pressure)
            plot(self.angle, self.c_pressure0)
        if self.ui.checkBox_2.isChecked():
            k += 1
            fig.tight_layout()
            subplot(int(str(n) + str(1) + str(k)))
            plot(self.angle, self.pressure)
            plot(self.angle, self.c_pressure)
        if self.ui.checkBox_3.isChecked():
            k += 1
            subplot(int(str(n) + str(1) + str(k)))
            plot(self.angle1, self.pressure1)
            plot(self.angle1, self.c_pressure_correct1)
        if self.ui.checkBox_4.isChecked():
            k += 1
            subplot(int(str(n) + str(1) + str(k)))
            plot(self.angle, self.speed_rolika)
        if self.ui.checkBox_5.isChecked():
            k += 1
            subplot(int(str(n) + str(1) + str(k)))
            plot(self.angle, self.nn1)
plt.show()Answer the question
In order to leave comments, you need to log in
The subplots function has key parameters ```sharex``` and ```sharey```. Well, there you can set ```all``` as a value so that the scale/shift across the entire grid is synchronized, or ```col`` and ```row``` so that only the current column or column is synchronized. Well, sort of like this for two graphs glued vertically.
fig, (ax1, ax2) = plt.subplots(2, 1, sharex='all', figsize=(640/my_dpi, 2*480/my_dpi), dpi=my_dpi)Didn't find what you were looking for?
Ask your questionAsk a Question
731 491 924 answers to any question