W
W
WantToBelieve2022-02-21 15:56:04
Debugging
WantToBelieve, 2022-02-21 15:56:04

Phpstorm: how to debug js run from command line?

Hello. I'm writing an executable node.js utility for the command line.
The call is made by the command

gendiff file1.json file2.json

where gendiff is the command itself, followed by the parameters.

package.json contains a section

"bin": {
    "gendiff": "bin/gendiff.js"
  },


In gendiff.js shenbang is specified
#!/usr/bin/env node

My question is the following. How can I debug command line javascript scripts in Phpstorm?

The existing instructions talk about how you can debug js using browser plugins or the node.js configuration in the IDE, but again, a browser is required there.

There are instructions that describe debugging scripts through the nodejs inspector, but I need breakpoints in the IDE and other Phpstorm debugging functionality.

Answer the question

In order to leave comments, you need to log in

2 answer(s)
W
WantToBelieve, 2022-02-21
@WantToBelieve

Solution:
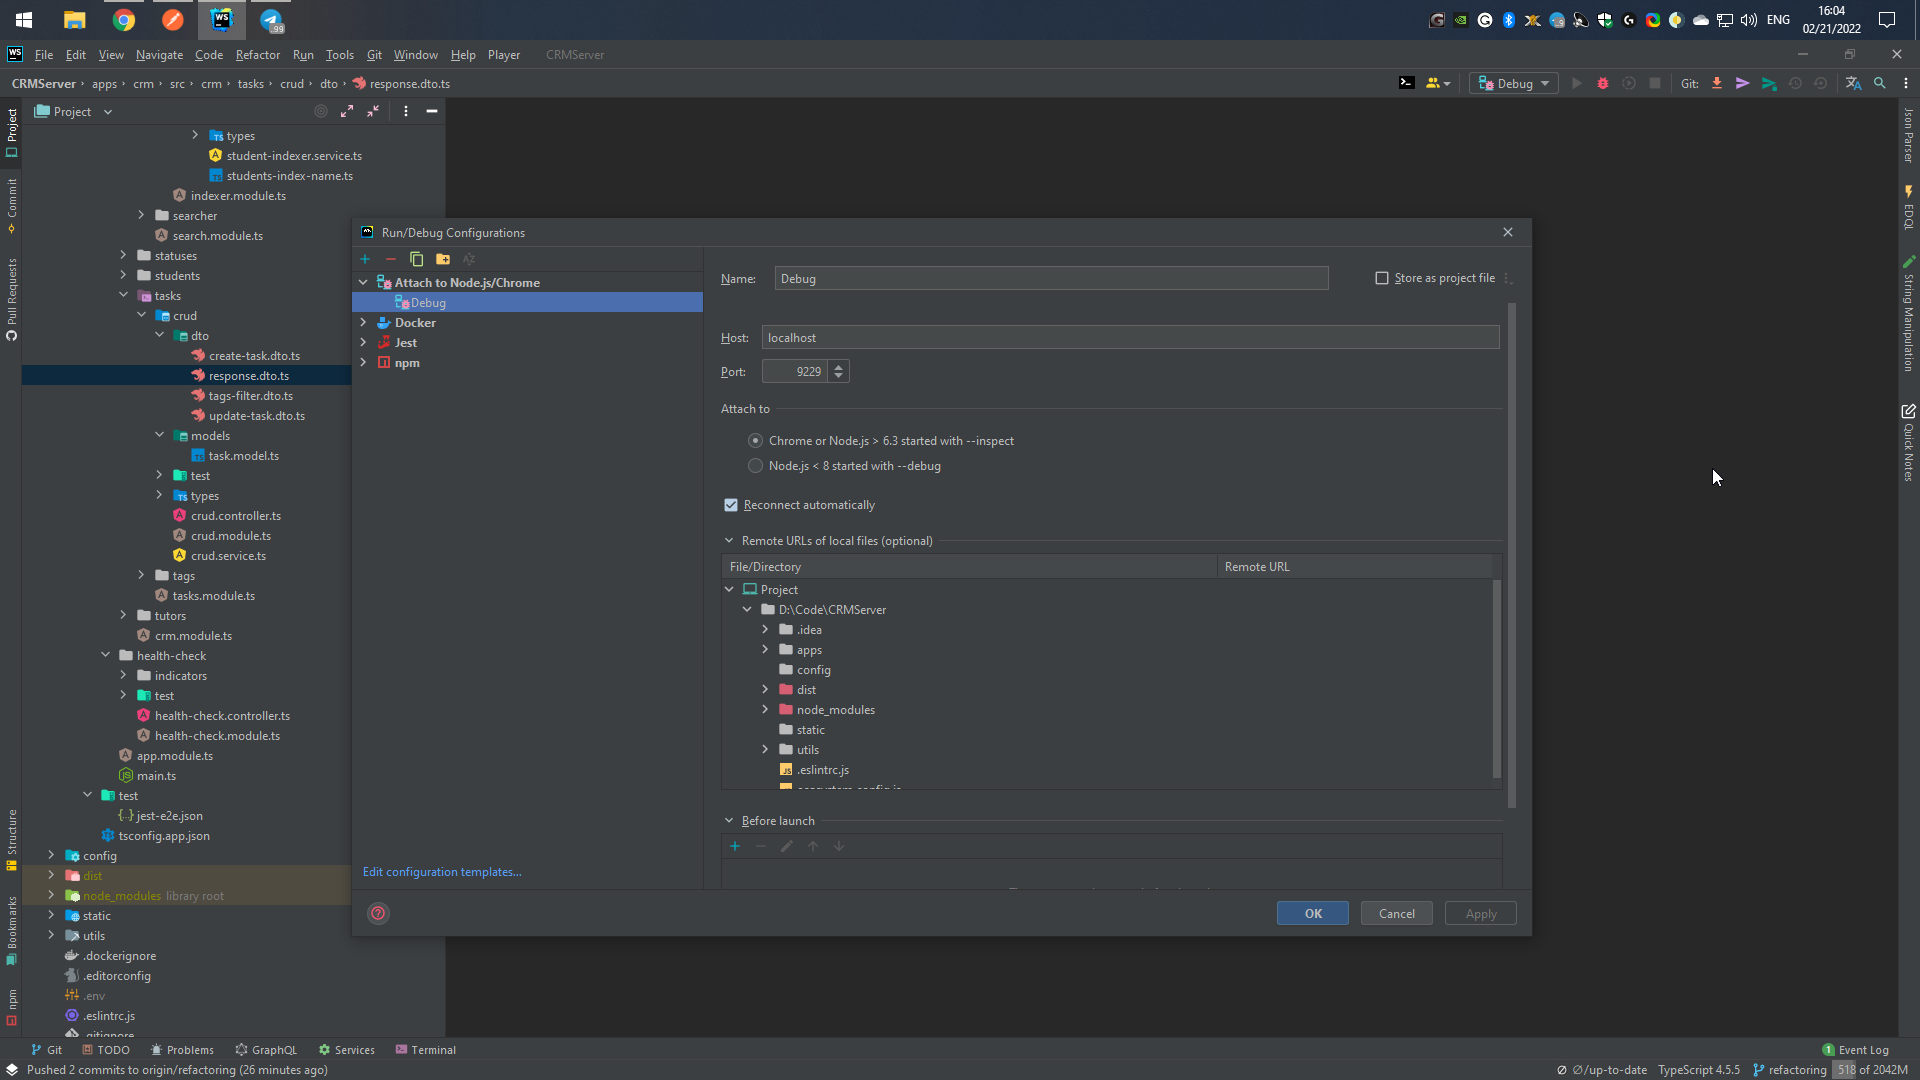
1. In the Phpstorm debug configurations, create the "Attach to Node.js/Chrome" profile,
specify the Attach to parameter there as Chrome or Node.js
2. In package.json in the scripts section, write the command

"произвольное имя": "node --inspect-brk <путь до файла> [параметры]"

3. Run the command from the console npm run <arbitrary name>
4. Start the debugging session configured in the first step
That's it, the script will stop where you specified the breakpoints.
What won't work:
1. Indication in shebang
#!/usr/bin/env -S node --inspect
The fact is that on Windows this line is ignored, but is used by npm when calling the npm link command, without which calling the package using a short command will not work.
npm link creates commands (by reading the shebang line and parameters from it) in a special directory, but there the script call refers to a package in the node_models folder.
It turns out that your code is launched from node_modeles, where there are no breakpoints and the Attach to Node.js/Chrome profile ignores this folder by default.
I tried adding breakpoints and adding the folder to listened to, but it didn't work the first time, and I don't want to waste any more time.
I may be confused in the details, if someone corrects I will be grateful.

R
Rag'n' Code Man, 2022-02-21
@iDmitriyWinX

Simply create the "Attach to Node.js/Chrome" profile in the debug configurations.
62138e0751eba556960758.png
And then somehow start your application in debugging mode.

Didn't find what you were looking for?

Ask your question

Ask a Question

731 491 924 answers to any question