Answer the question
In order to leave comments, you need to log in
Performance sag mariadb, linux. Why is the Load Average growing to 30-40?
Hello.
There is a server with an 8-core CPU, RAM 32GB, 2 SSD RAID 1 (mdadm, lvm), Centos 7.
Database: 10.3.16-MariaDB. The project on Bitrix is running on the server.
The average load on the database is from 1 to 4 thousand requests per second. With such a load, the server worked for ~ 4 months. and the load average of the server was about 0.7-2. mysqld load ranged from 50% to 200%.
But something went wrong , performance began to degrade dramatically.
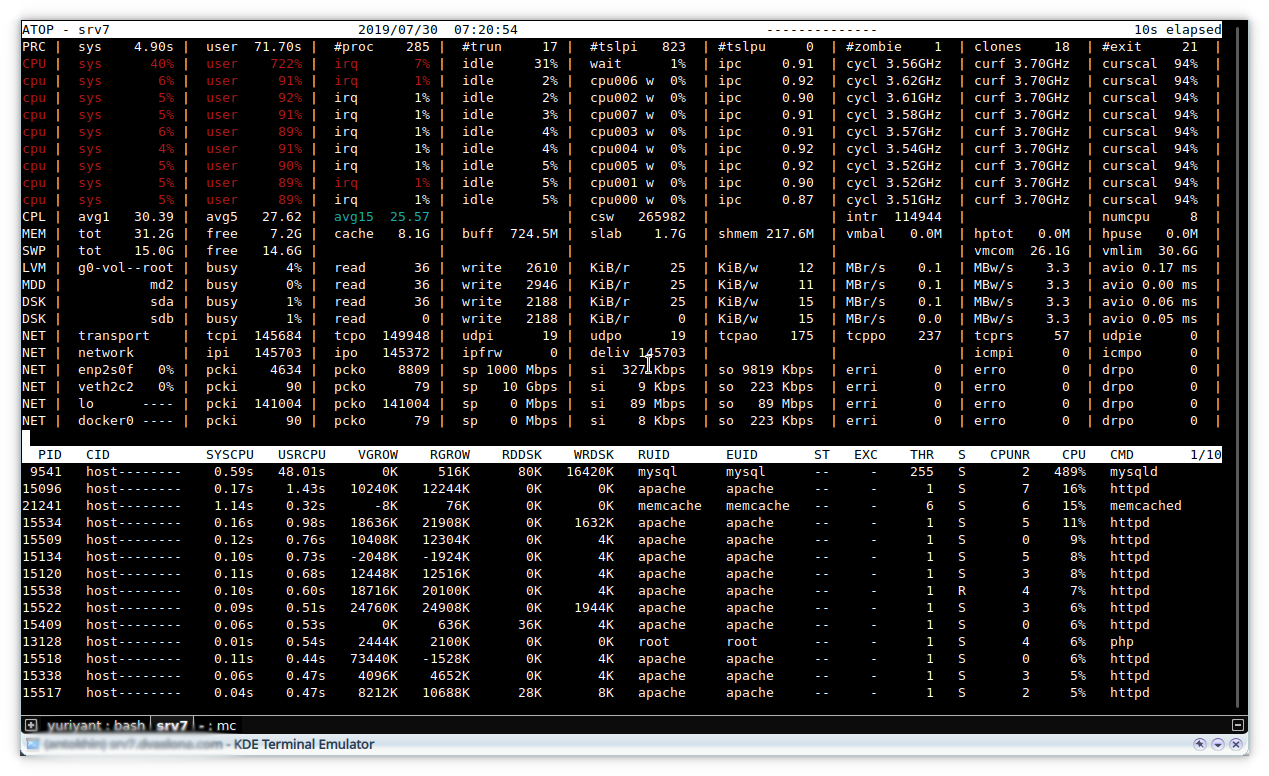
Now the base daemon loads the system by top by 400-600%, and the load average reaches 40. And such a load average can be both at 400% and at 600% of the load given by mysqld.
According to observations, there are moments and performance does not return for a long time. With equal database metrics for count. requests, the load may return to normal for some time up to load average: 1-2.
Restarting the server or mysqld has no effect.
Spent a few days looking for a relationship between database and operating system metrics in order to find a relationship in the deviations, but so far could not.
Theoretically, it may not even be a database, hardware, or something else.
Initially, I thought that something might be wrong with the disks, but trim is enabled, according to atop, the disk system is loaded by 3-7%.
SSD model
Model Family:     Intel S4510/S4610/S4500/S4600 Series SSDs
Device Model: INTEL SSDSC2KB240G8Read: sda min: 0.13 ms, max: 30.04 ms, avg: 0.66 ms
Read: sdb min: 0.01 ms, max: 27.37 ms, avg: 0.90 ms
Write: sda min: 0.09 ms, max: 8.33 ms, avg: 1.34 ms
Write: sdb min: 0.09 ms, max: 10.48 ms, avg: 1.41 ms
[mysqld]
key-buffer-size = 32M
long_query_time=1
performance_schema=on
read_rnd_buffer_size=128K
sort_buffer_size=1M
read_buffer_size=128K
join_buffer_size=512K
max_allowed_packet=64M
sql_mode=
transaction-isolation=READ-COMMITTED
innodb_io_capacity = 3000
innodb_io_capacity_max = 6000
innodb_read_io_threads = 64
innodb_write_io_threads = 64
innodb_thread_concurrency=10
innodb_lru_scan_depth=100
open_files_limit = 65535
table_open_cache=5000
query_cache_min_res_unit=3000
thread_cache_size=500
innodb_flush_method=O_DIRECT
innodb_file_per_table = 1
innodb_flush_log_at_trx_commit=2
innodb_log_buffer_size=12M
query_cache_type=1
query_cache_size=128M
query_cache_limit=1M
query_cache_min_res_unit=3500
tmp_table_size=1024M
max_heap_table_size=1024M
innodb_buffer_pool_size=15G
innodb_log_file_size=1G
innodb_log_files_in_group=3
innodb_buffer_pool_instances=15core file size (blocks, -c) 0
data seg size (kbytes, -d) unlimited
scheduling priority (-e) 0
file size (blocks, -f) unlimited
pending signals (-i) 127750
max locked memory (kbytes, -l) 64
max memory size (kbytes, -m) unlimited
open files (-n) 65535
pipe size (512 bytes, -p) 8
POSIX message queues (bytes, -q) 819200
real-time priority (-r) 0
stack size (kbytes, -s) 8192
cpu time (seconds, -t) unlimited
max user processes (-u) 65535
virtual memory (kbytes, -v) unlimited
file locks (-x) unlimited=====================================
2019-07-30 06:57:50 0x7f9e40f63700 INNODB MONITOR OUTPUT
=====================================
Per second averages calculated from the last 1 seconds
-----------------
BACKGROUND THREAD
-----------------
srv_master_thread loops: 1621 srv_active, 0 srv_shutdown, 1 srv_idle
srv_master_thread log flush and writes: 1622
----------
SEMAPHORES
----------
OS WAIT ARRAY INFO: reservation count 320574
--Thread 140317647853312 has waited at btr0sea.cc line 1476 for 0.00 seconds the semaphore:
X-lock (wait_ex) on RW-latch at 0x55fd09116700 created in file btr0sea.cc line 243
a writer (thread id 140317647853312) has reserved it in mode wait exclusive
number of readers 1, waiters flag 1, lock_word: ffffffff
Last time write locked in file btr0sea.cc line 1557
--Thread 140317668058880 has waited at btr0sea.cc line 934 for 0.00 seconds the semaphore:
S-lock on RW-latch at 0x55fd09116700 created in file btr0sea.cc line 243
a writer (thread id 140317647853312) has reserved it in mode wait exclusive
number of readers 1, waiters flag 1, lock_word: ffffffff
Last time write locked in file btr0sea.cc line 1557
--Thread 140317670516480 has waited at btr0sea.cc line 934 for 0.00 seconds the semaphore:
S-lock on RW-latch at 0x55fd09116700 created in file btr0sea.cc line 243
a writer (thread id 140317647853312) has reserved it in mode wait exclusive
number of readers 1, waiters flag 1, lock_word: ffffffff
Last time write locked in file btr0sea.cc line 1557
--Thread 140317639866112 has waited at btr0sea.cc line 934 for 0.00 seconds the semaphore:
S-lock on RW-latch at 0x55fd09116700 created in file btr0sea.cc line 243
a writer (thread id 140317647853312) has reserved it in mode wait exclusive
number of readers 1, waiters flag 1, lock_word: ffffffff
Last time write locked in file btr0sea.cc line 1557
OS WAIT ARRAY INFO: signal count 10122942
RW-shared spins 0, rounds 40759553, OS waits 237147
RW-excl spins 0, rounds 994262, OS waits 71533
RW-sx spins 220, rounds 1828, OS waits 40
Spin rounds per wait: 40759553.00 RW-shared, 994262.00 RW-excl, 8.31 RW-sx
------------
TRANSACTIONS
------------
.......
ROW OPERATIONS
--------------
10 queries inside InnoDB, 1 queries in queue
10 read views open inside InnoDB
Process ID=9541, Main thread ID=140317842663168, state: sleeping
Number of rows inserted 17731, updated 22665, deleted 12861, read 5275053684
2.00 inserts/s, 19.98 updates/s, 0.00 deletes/s, 4063602.40 reads/s
Number of system rows inserted 0, updated 0, deleted 0, read 0
0.00 inserts/s, 0.00 updates/s, 0.00 deletes/s, 0.00 reads/s
----------------------------
END OF INNODB MONITOR OUTPUT
============================-------- Recommendations ---------------------------------------------------------------------------
General recommendations:
Control warning line(s) into /var/log/mariadb/mysql_error.log file
Control error line(s) into /var/log/mariadb/mysql_error.log file
MySQL was started within the last 24 hours - recommendations may be inaccurate
Increasing the query_cache size over 128M may reduce performance
Adjust your join queries to always utilize indexes
Consider installing Sys schema from https://github.com/mysql/mysql-sys
Variables to adjust:
query_cache_size (=0)
query_cache_type (=0)
query_cache_size (> 128M) [see warning above]
join_buffer_size (> 512.0K, or always use indexes with JOINs)


Answer the question
In order to leave comments, you need to log in
Thanks everyone for the help and advice!
Two manipulations were made at once to help solve the problem. Which of them solved the problem, I can’t say for sure.
Bitrix has a table with catalog discount coupons, we had 300 thousand coupons in it. Since it is not possible to change the request due to its systemic nature and updating Bitrix will overwhelm everyone, tests were carried out with the data. Removing 200 thousand old coupons from the table made it possible to speed up a slow query from ~1.3 sec. up to 0.01 sec. There are 60 thousand coupons left in the table.
We will finalize the automatic coupon cleaning system and write an appeal to Bitrix with a request to optimize the request. Although the slow request, according to the monitoring data, worked out ~ 3.7 times per second, but this did not prevent it from choking the processor.
The second event is the transition from mariadb (10.1, 10.3 - both versions were tested for several days) to percona 8. The assumption fell on a database problem with our data set and queries, there was a thought, but suddenly I know in percon and eliminated the error.
I still believe that the key factor here was Vitaly Karasik pointed out to a slow request.
Apparently, on our data, this request caused locks and high CPU load due to an increase in the values of the RW Locks S OS Waits, RW Locks X OS Waits, RW Locks S Spin Rounds, RW Locks X Spin Rounds metrics. There were more coupons and at some point in time their number. became critical for the request.
Floating LA, independent of the number of queries to the database, turned out to be the influence of calling cron jobs on uploading catalogs to the Yandex Market. I will bind the display of the tasks of Biriks agents (task crons) on the charts in order to more clearly build connections between the load and the application in the future.
UPDATE
08/09/2019 The database was returned to mariadb 10.3. It turned out one more request that increases the load on the CPU. We have about 1 million sessions in the database. So Bitrix in the Sale\Fuser::getIdByUserId($ID) method for getting one record does not set a limit and also sorts the entire selection. If FALSE is passed, then in our case it sorted about 1 million records + added 1 more record there each time. An appeal to Bitrix has been sent, they have accepted it and, apparently, an update will be released soon.
Who needs a solution now - change the method right in the Sale\Fuser::getIdByUserId core in this way.
$res = FuserTable::getList(array(
                       'filter' => array(
                               'USER_ID' => $userId
                       ),
                       'select' => array(
                               'ID'
                       ),
                       'limit' => 1, // Добавить лимит
                       // 'order' => array('ID' => "DESC") // Убрать эту сортировку
));a lot of interesting things, but I did not see the type of table engines.
maybe somewhere there is a MyISAM table that is blocked, and in the first line key-buffer-size = 32M is written incorrectly, it just affects the speed of MyISAM tables, with this configuration you can set 1G
key_buffer_size = 1G
myisam_sort_buffer_size = 128M
myisam_max_sort_file_size = 10G
myisam_max_extra_sort_file_size = 10G
Didn't find what you were looking for?
Ask your questionAsk a Question
731 491 924 answers to any question