Answer the question
In order to leave comments, you need to log in
OxyPlot how to fix dimensions of visible part of PlotView?

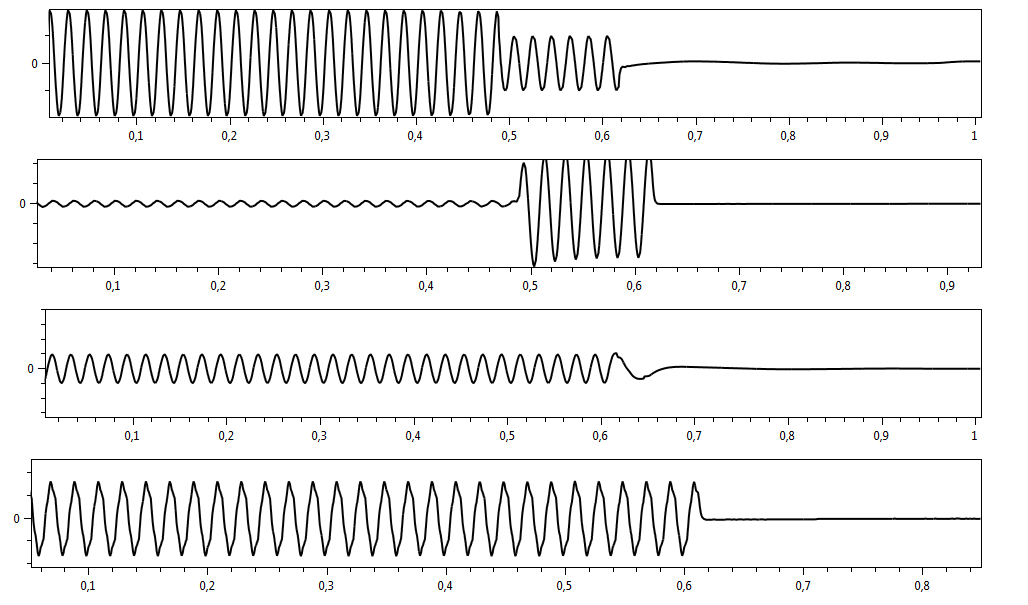
I made these oscillograms in OxyPlot.
In theory, this rectangular box should be the same size for all of them (the Height and Width properties are identical for all PlotViews). De facto, it begins to change size when zoomed in, and even when creating the chart itself, it is different from different source data.
As I understand it, there is some kind of stupid dynamic update of labels on the axes, such as when the number of labels approaches, they become with a large number of numbers, and the dimensions of the rectangle are adjusted. But I don't need it at all
. How can I rigidly fix the size of the rectangle of the visible area of the chart?
Answer the question
In order to leave comments, you need to log in
Didn't find what you were looking for?
Ask your questionAsk a Question
731 491 924 answers to any question