Answer the question
In order to leave comments, you need to log in
Mysql: Why can query execution speed jump?
Good evening!
Tell me why the following situation can occur (and where to dig?): I
execute a query, it gives out:
Query took 3.8722 seconds
, I
immediately run it again, it says:
Query took 0.0001 seconds
I wait ~ 12–13 seconds, I run it and again everything repeats in a circle.
Sample query (there are similar ones with the same behavior, not only this one): 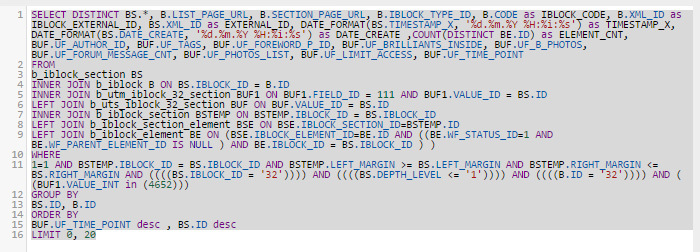
Just in case, from mysqltuner: 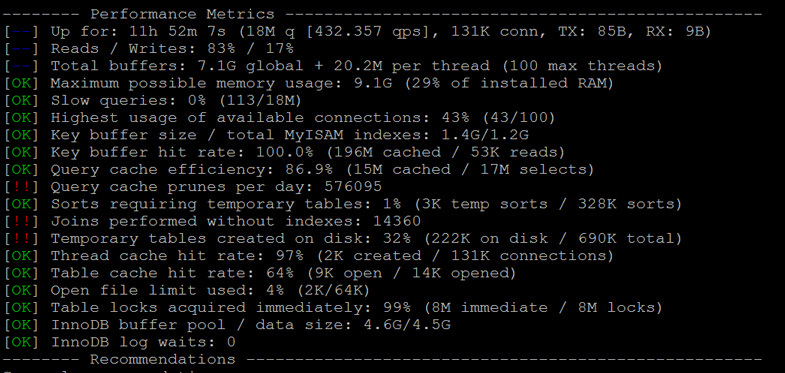
.
UPD as an analysis for colleagues maintaining sites on Bitrix:
the sample in the example is made from a table with partitions, a table with elements, and a pair of auxiliary tables with properties. In Bitrix, all sections that are only on the site are poured into a common table, and all elements that are only on the site are poured into a common table. Based on the description , and also paying special attention to:
“ Caching of selections from InnoDB tables is handled separately. MySQL removes the results of selections from the cache upon any table change (I will clarify: a change in any of the tables) inside the transaction "
... we come to the following conclusions:
1.A partitioned table should not be updated as actively as other tables. If strange query behavior is observed, some kind of counter is updated somewhere in the table itself (for example, comments or views). It’s almost impossible to catch strange behavior at work (no one pecks pages with ?clear_cache=Y , trying to understand how requests behave), but when designing or analyzing an infoblock, you can stumble upon the fact that a counter is stored in one of the fields (even sometimes in standard fields like CODE or SORT). You need to get rid of this (take it out in hl-blocks, use ORM or pour it into statics).
2.The same is true for elements. Here, one more example suggests itself: there is a “standard” field for storing the number of comments (its appearance grows from the forums module): FORUM_MESSAGE_CNT . If we perform a selection of elements along with a selection of the value of this field, a situation may arise when our element is not updated, and the cache is reset, because the query contains a link to the table that stores the counter. It is worth analyzing and it is possible to make a selection with two separate queries.
3. We actively use HL-blocks and ORM to break these two common tables into independent parts.
4. The load and the situation described in the example were caused by the checkbox " Display the number of elements " was set in the component» (it counts how many elements are contained in each of the tables in the sample). At what almost two identical requests were formed: a direct selection of sections and a counter (COUNT) by elements. If you do not need this counter, turn it off. From experience, in 99% of cases it is needed only in the admin panel. Or if it is needed, get out a separate base of counters, which is updated on an event (adding / updating / deleting elements). We recalculated exactly when necessary, and then we use the statistics.
Answer the question
In order to leave comments, you need to log in
Didn't find what you were looking for?
Ask your questionAsk a Question
731 491 924 answers to any question