Answer the question
In order to leave comments, you need to log in
Make a graph of the signal spectrum?
Hello, tell me how to make such a graph in matlabe? What function displays such a graph. If anything, this is the spectrum of the AIM signal.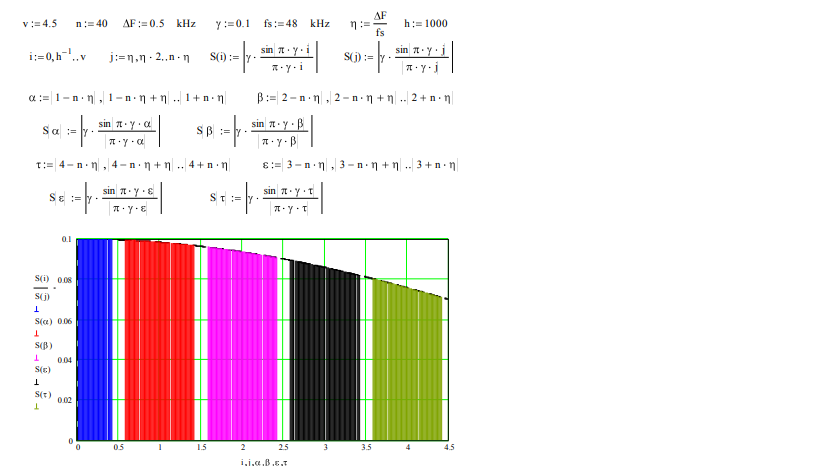
Answer the question
In order to leave comments, you need to log in
Didn't find what you were looking for?
Ask your questionAsk a Question
731 491 924 answers to any question