Answer the question
In order to leave comments, you need to log in
Linear interpolation?
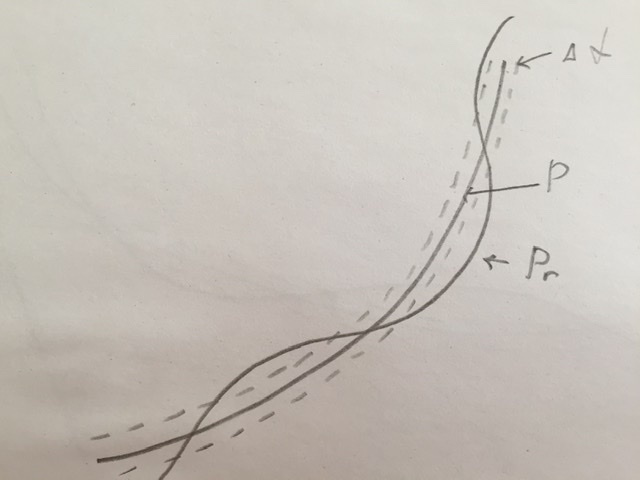
Good afternoon! There is such an interesting problem, there is a calculated graph of some process P (say, a semi-hyperbola), there is a graph of the real process Pr (it turns out, approximately, the same semi-hyperbola, but with slight deviations in the sections). The calculation chart has some allowable range of delta value change (+-1). Some kind of tricky interpolation device is needed so that the resulting line averages both graphs and passes as much as possible in the allowable range (of course, there may be small out of range). Picture:
Answer the question
In order to leave comments, you need to log in
so that the resulting line averages both graphs
Didn't find what you were looking for?
Ask your questionAsk a Question
731 491 924 answers to any question