Answer the question
In order to leave comments, you need to log in
Is there a formula for calculating the number of jumps on a graph?
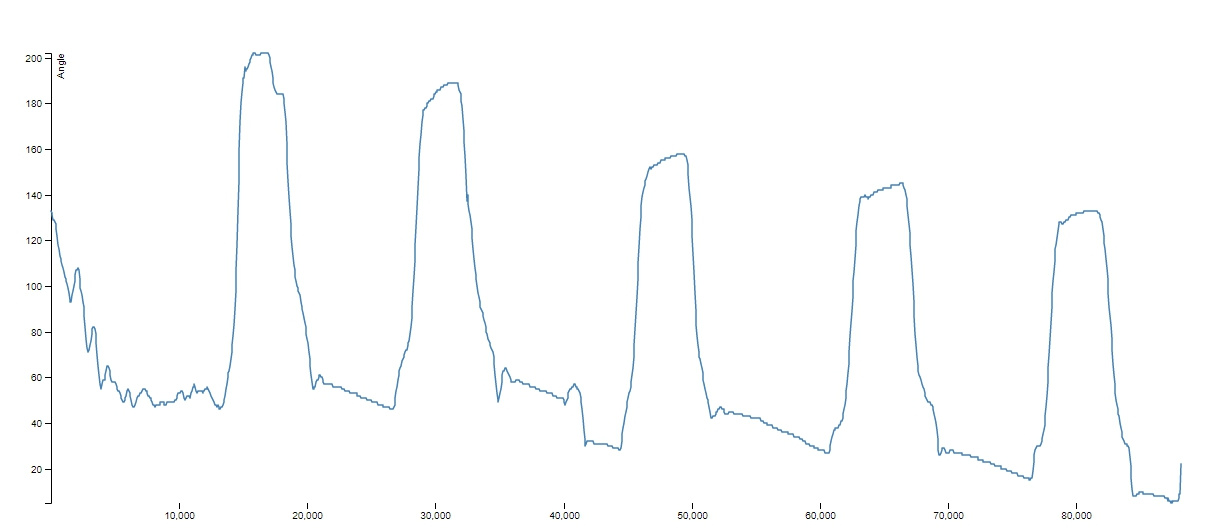
There are 1000 digits that show the change in angle from the sensor (accelerometer) over time. Here's a graph: 
The computer needs to calculate how many of these "shocks" are shown on the graph. You can think of an algorithm without problems, but maybe there is some simple mathematical formula for calculating such things? I would be grateful for a direction.
Answer the question
In order to leave comments, you need to log in
1. Align the graph using the moving average: here
2. Find all the extrema of the function (breakpoints/changes of direction): here
You can first use a low-pass filter (for example, a moving average), and then a simple calculation of the maxima (due to low-frequency there will be a delay). Just in case, introduce a restriction on the minimum distance (in time) between the maxima (or, as the comrade suggested, the amplitude threshold).
This is definitely needed here . The classic wavelet transform problem. For particularly smart people, I will explain that for this problem it is necessary to use a discrete transformation.
It is also possible to determine the peaks by the sign of the derivative, first you need to smooth the chart with a moving average, for example. A moving average for a digital signal can be used like this:
(z^-1 is the delay of the signal by 1 clock, z^-d is the delay of the signal by d clocks, where d is the length of the window)
I would look in the direction of the Fourier transform: we determine the dominant harmonic (possibly with some heuristics to remove the noise) and multiply its frequency by the duration of the observation.
Didn't find what you were looking for?
Ask your questionAsk a Question
731 491 924 answers to any question