Answer the question
In order to leave comments, you need to log in
Is it possible to build a presentable/beautiful graph in Python?
I'm starting to learn the SciKit and Matplotlib libraries.
I read that Python is far from the best tool for data visualization, but still, I would like to know in advance if Python has the ability to build presentable graphs through the above libraries?
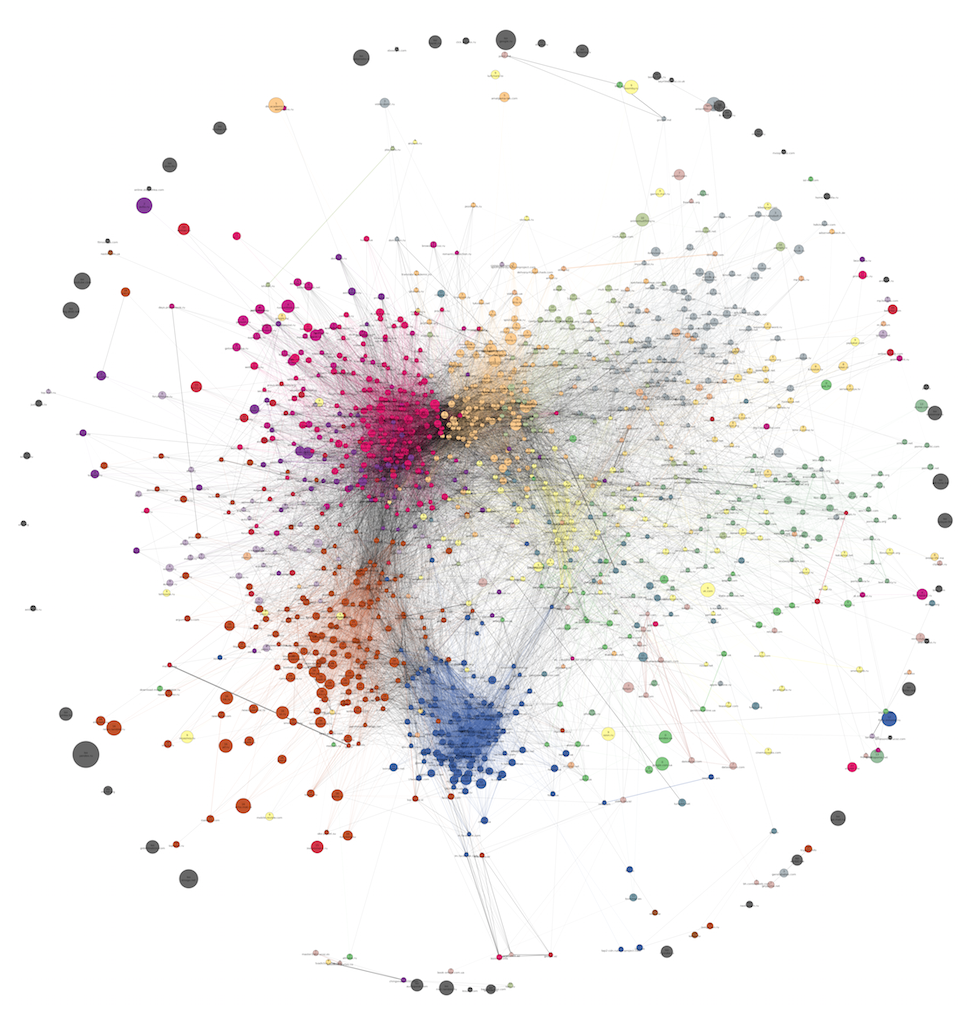
For example, is it possible to build something similar to such a graph? 
Thanks in advance
Answer the question
In order to leave comments, you need to log in
Oh my Count! Built in python, in networkx. Not a very optimal way, besides, a lot of new things have appeared since then. I can send the code.
Didn't find what you were looking for?
Ask your questionAsk a Question
731 491 924 answers to any question