Answer the question
In order to leave comments, you need to log in
Is it possible to automate the filling of the table with values from the chart (picture)?
We have a graph in the form of a picture: 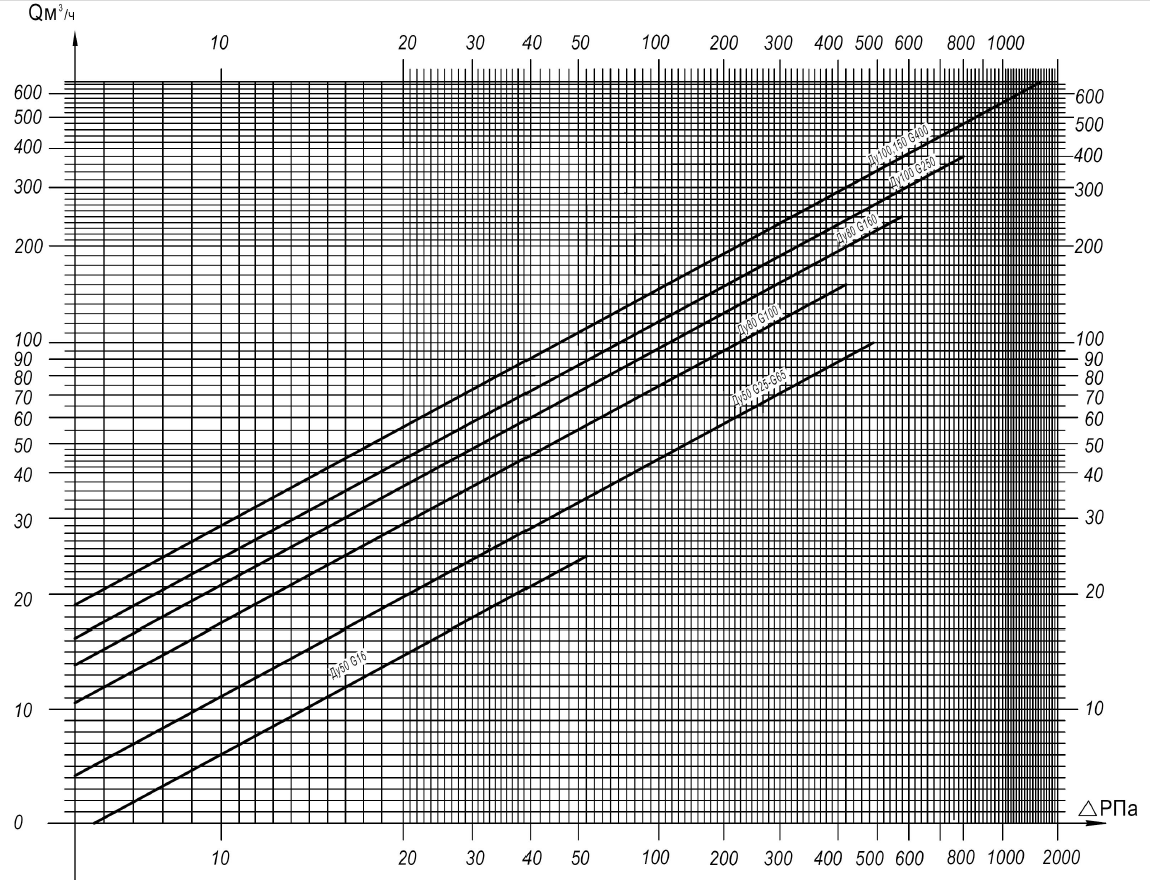
Purpose:
Get rid of manual work (knowing the diameter Du and the difference dP, we are looking for the flow Q), by compiling a table of values so that by selecting the required diameter (Dn) and entering the difference (dP), we can get the flow Q.
As a result, an android application will be created.
Problem and question:
Yes, you can manually sit for hours with a ruler at the monitor and fill out the table, but are there tools to speed up this process ? Point my shovel, where to dig?
As I see it:
1) Insert a picture as a base (for example, as in Photoshop), in this picture we set points manually along the X and Y axes;
2) Set values for these points (for example, for the Y axis: 0, 1, 2...8, 9, 10...20...30...40, etc.).
3) We create lines ("paths") for each diameter Du.
4) Make a slider or/and right/left keys to move along the X axis.
5) Move along the X axis from 0 to 2000 and get the values corresponding to each diameter.
6) We form manually five tables for each diameter of the X and Y values,
Answer the question
In order to leave comments, you need to log in
In fact, everything is exactly the opposite. Pictures like yours are the result of displaying some well-known function. They were used in the "pre-computer" era, when the calculation of a function was quite complicated (at least for those who had to use this formula). Therefore, in order to free them from the need for manual calculation, they calculated the function once, drew such graphs and replicated them.
Today the situation is fundamentally different. It's easier to find the function(s) that underlies the graph and write a simple application. Going the other way is at least somewhat strange.
Well, or if it’s completely unbearable, then using the fact of the logarithmic dependence of the data on the graph, build a straight line formula for two points, and then apply the inverse logarithmic transformation. Something like that.
If you take this particular graph, then you have all linear functions. They can be specified with simple formulas. And then you create a column of arguments and calculate all possible values of the function, with any step.
Changing the grid can also be written as a function.
It depends on who how to use the schedule.
Didn't find what you were looking for?
Ask your questionAsk a Question
731 491 924 answers to any question