Answer the question
In order to leave comments, you need to log in
How to work in Storm with Xdebug?
Recently there was a question Remote debug in PhpStorm, how? according to his answer, I set everything up
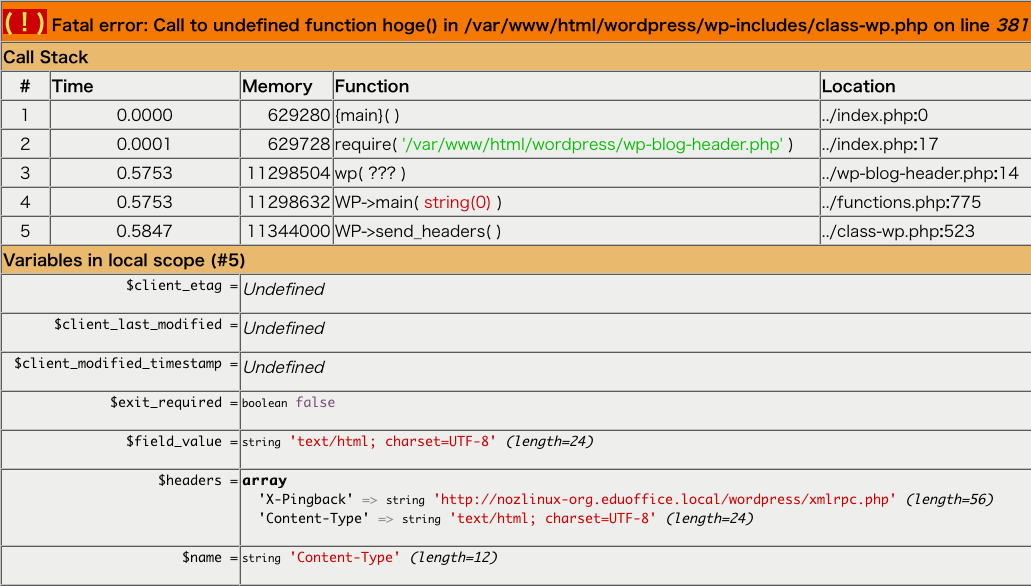
1. Installed xdebug on the server, var_dump is beautiful, everything works
2. Set up Deployment / Configuration
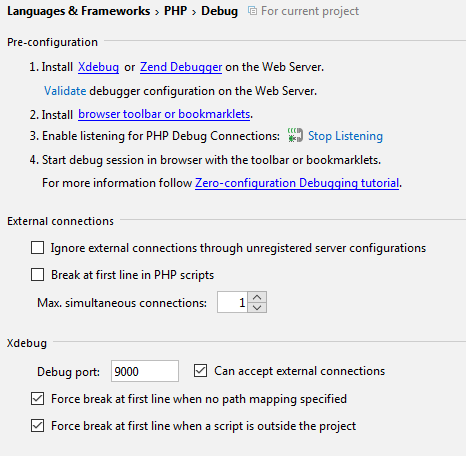
3. Went into the debug settings, port 9000 is registered there, debug, as I understand it, is enabled
Answer the question
In order to leave comments, you need to log in
Didn't find what you were looking for?
Ask your questionAsk a Question
731 491 924 answers to any question