Answer the question
In order to leave comments, you need to log in
How to visualize data consisting of coordinate and magnitude?
There is a map, several coordinates on this map with magnitude values for each parameter, for example:
coordinate 1:
parameter 1=20
parameter 2=30
coordinate 2:
parameter 3=20
parameter 2=100
coordinate 3
parameter 4=10
parameter 1=10
Each parameter is a characteristic of the object located on the map at an unknown point.
Tell me how and / or how to visualize such data to analyze the location of objects?
Answer the question
In order to leave comments, you need to log in
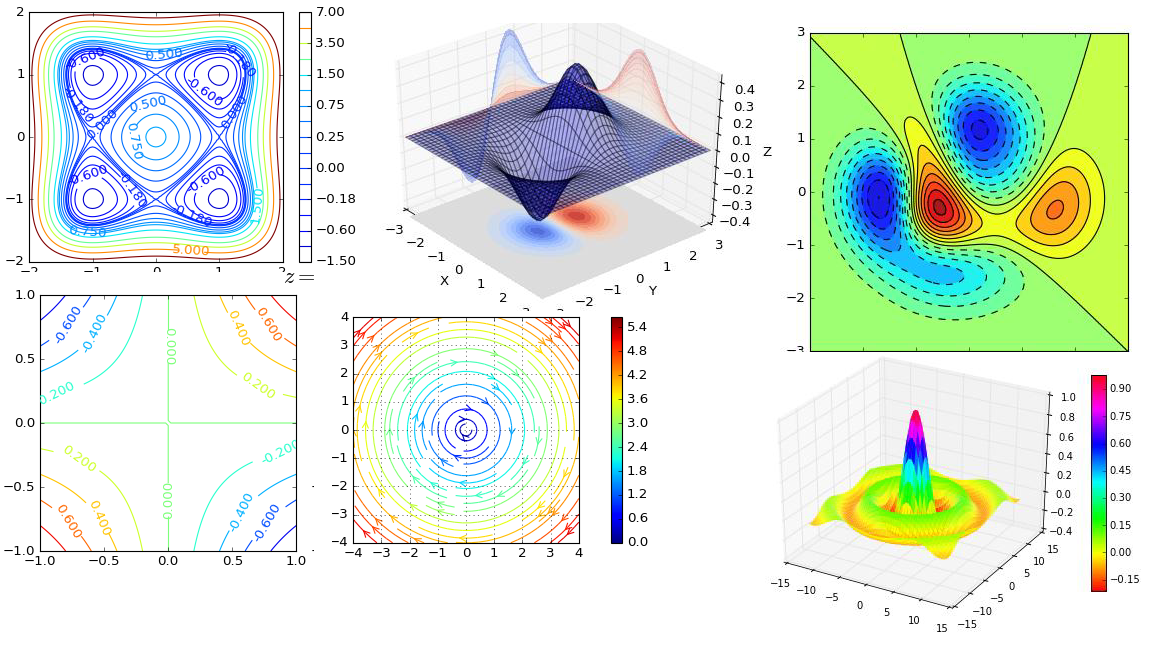
I read and read, but I did not fully understand what you need. Are these two-dimensional graphs, where the color or the third coordinate depends on the value of the parameter? Or something different? And yes, all these graphs are built exactly according to the given values in points, of course.
Didn't find what you were looking for?
Ask your questionAsk a Question
731 491 924 answers to any question