Answer the question
In order to leave comments, you need to log in
How to understand what loads VPS?
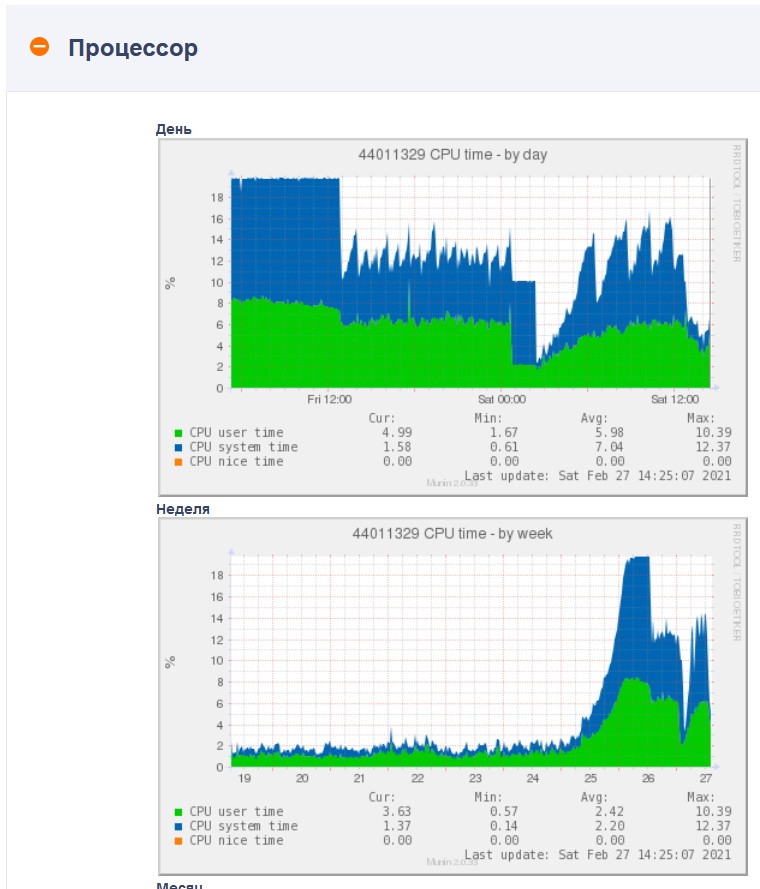
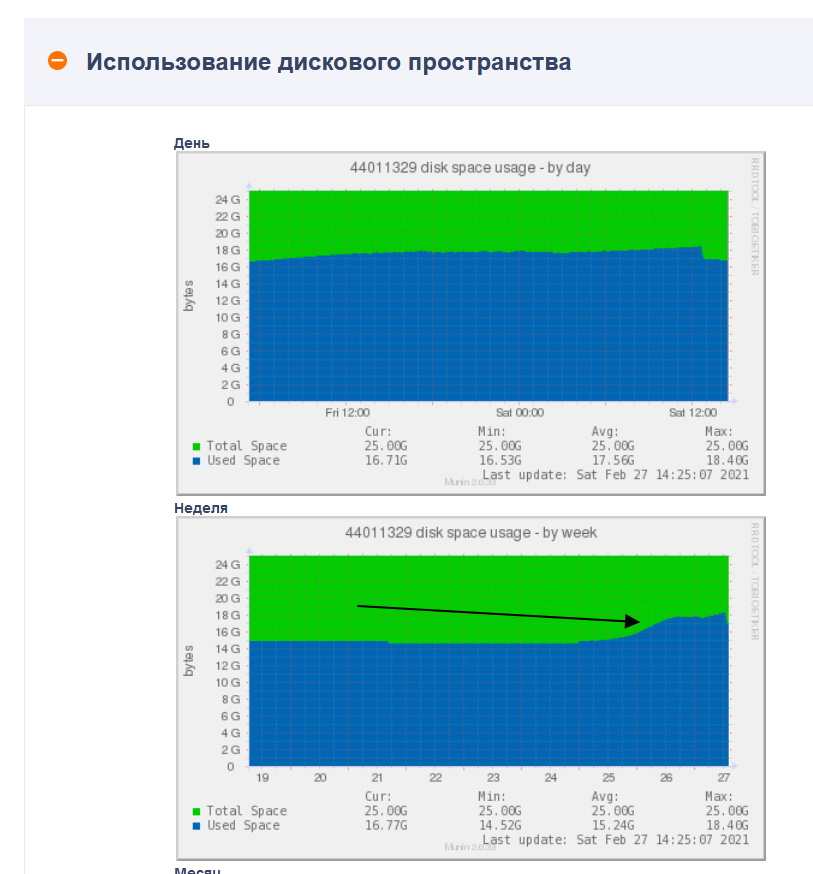
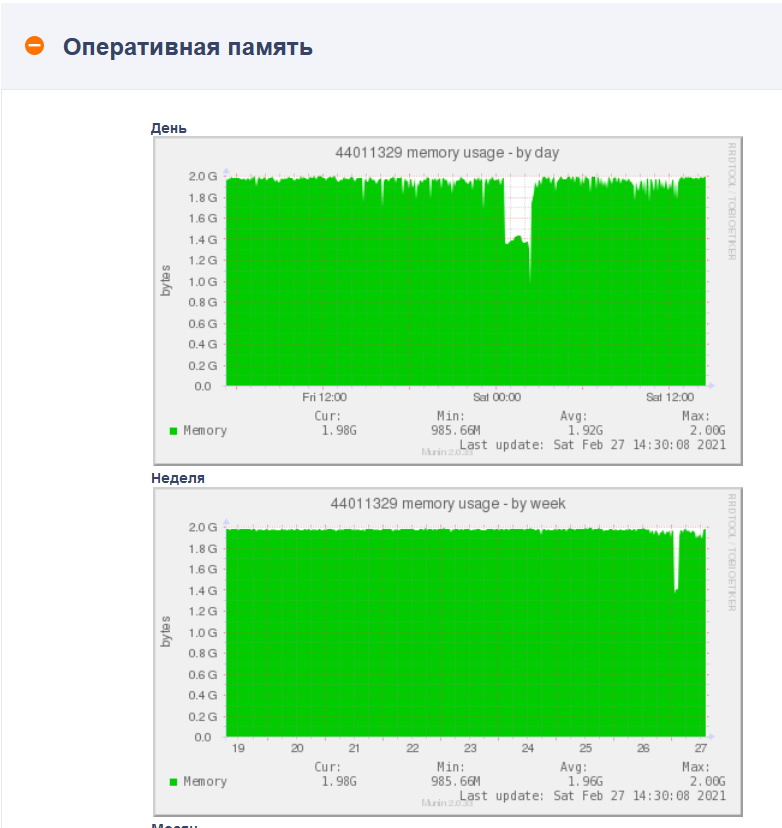
Hello. There are VPS. A couple of days ago this started:


Hosting started writing angry letters:
We notify you that on your VPS the Load Average value has reached a critical level, in connection with which the following processes have been stopped: sbin/licctlGoogled about the sbin/licctl process, it kind of refers to a request to use a license or something, and for many it also loads the CPU . I bought a license from a hoster, the situation immediately got better (this can be seen on the graphs).

ps axo rss,comm,pid | awk '{ proc_list[$2] += $1; } END { for (proc in proc_list) { printf("%d\t%s\n", proc_list[proc],proc); }}' | sort -n | tail -n 10 | sort -rn | awk '{$1/=1024;printf "%.0fMB\t",$1}{print $2}'746MB metric
520MB core
431MB mysqld
180MB php
109MB apache2
93MB cron
35MB cron-ispmgr
34MB fail2ban-server
33MB sh
16MB namedfree -m:total used free shared buff/cache available
Mem: 2048 1637 0 86 410 138
Swap: 0 0 0Answer the question
In order to leave comments, you need to log in
UPD:
Unfortunately, the panel found a problem that without a license, processes can accumulate. To avoid repeating the CPU problem, you can comment out the metrics rule in the cron job scheduler as follows:
###*/5 * * * * /usr/local/mgr5/sbin/cron-ispmgr sbin/metric >/dev/null 2>&1
To free the disk, delete the files in the /usr/local/mgr5/var/ispmgr_metric/ directory
An error in the panel operation has been registered. At the moment, we cannot specify how long it will take to resolve it. All errors are resolved in order of internal priority.
Googled about the sbin/licctl process, it kind of refers to a request to use a license or something, and for many it also loads the CPU. I bought a license from a hoster, the situation immediately got better (this can be seen on the graphs).Oh, they are cunning...
htop - similar to top, shows the current activity of processes
atop - a powerful process activity analyzer with file logging. -
https ://firstvds.ru/technology/statistika-nagruzki...
you can record, for example, 1 minute / 10 minutes / 1 hour of activity time to a file and then watch every second or how you recorded all the activity of processes, who ate how much memory and processor, disk, etc.
ps aux|grep metric
It will show the path to the executable file, if anything, the output of the command to the studio :)
it's some sort of rip-off.
what kind of license?
just use the top command to see the load.
if st is high, hosting, or rather neighboring VPS steal your CPU - the node is overloaded. It's not your fault, but the host's.
If your software slows down - demand a transfer to another node or dump it to another host.
Didn't find what you were looking for?
Ask your questionAsk a Question
731 491 924 answers to any question