Answer the question
In order to leave comments, you need to log in
How to understand what is wrong in terms of the atop utility?
Good afternoon. I'm trying to figure out what's happening on the server.
At some point, the site stops working.
when monitoring htop - it shows that the memory is running out sharply, 16GB is available, on average 3-4GB is used, suddenly abruptly (2-3 seconds) rises almost to the limit and starts to fill up swap
mysqld immediately stops working, the queue starts to accumulate at the same time, after it restart (its restart takes about 10-15 minutes), the site is available again.
I started atop and see the mysqld CPU jumps from 12% to 150% and the line is highlighted in red NET eth0 98%
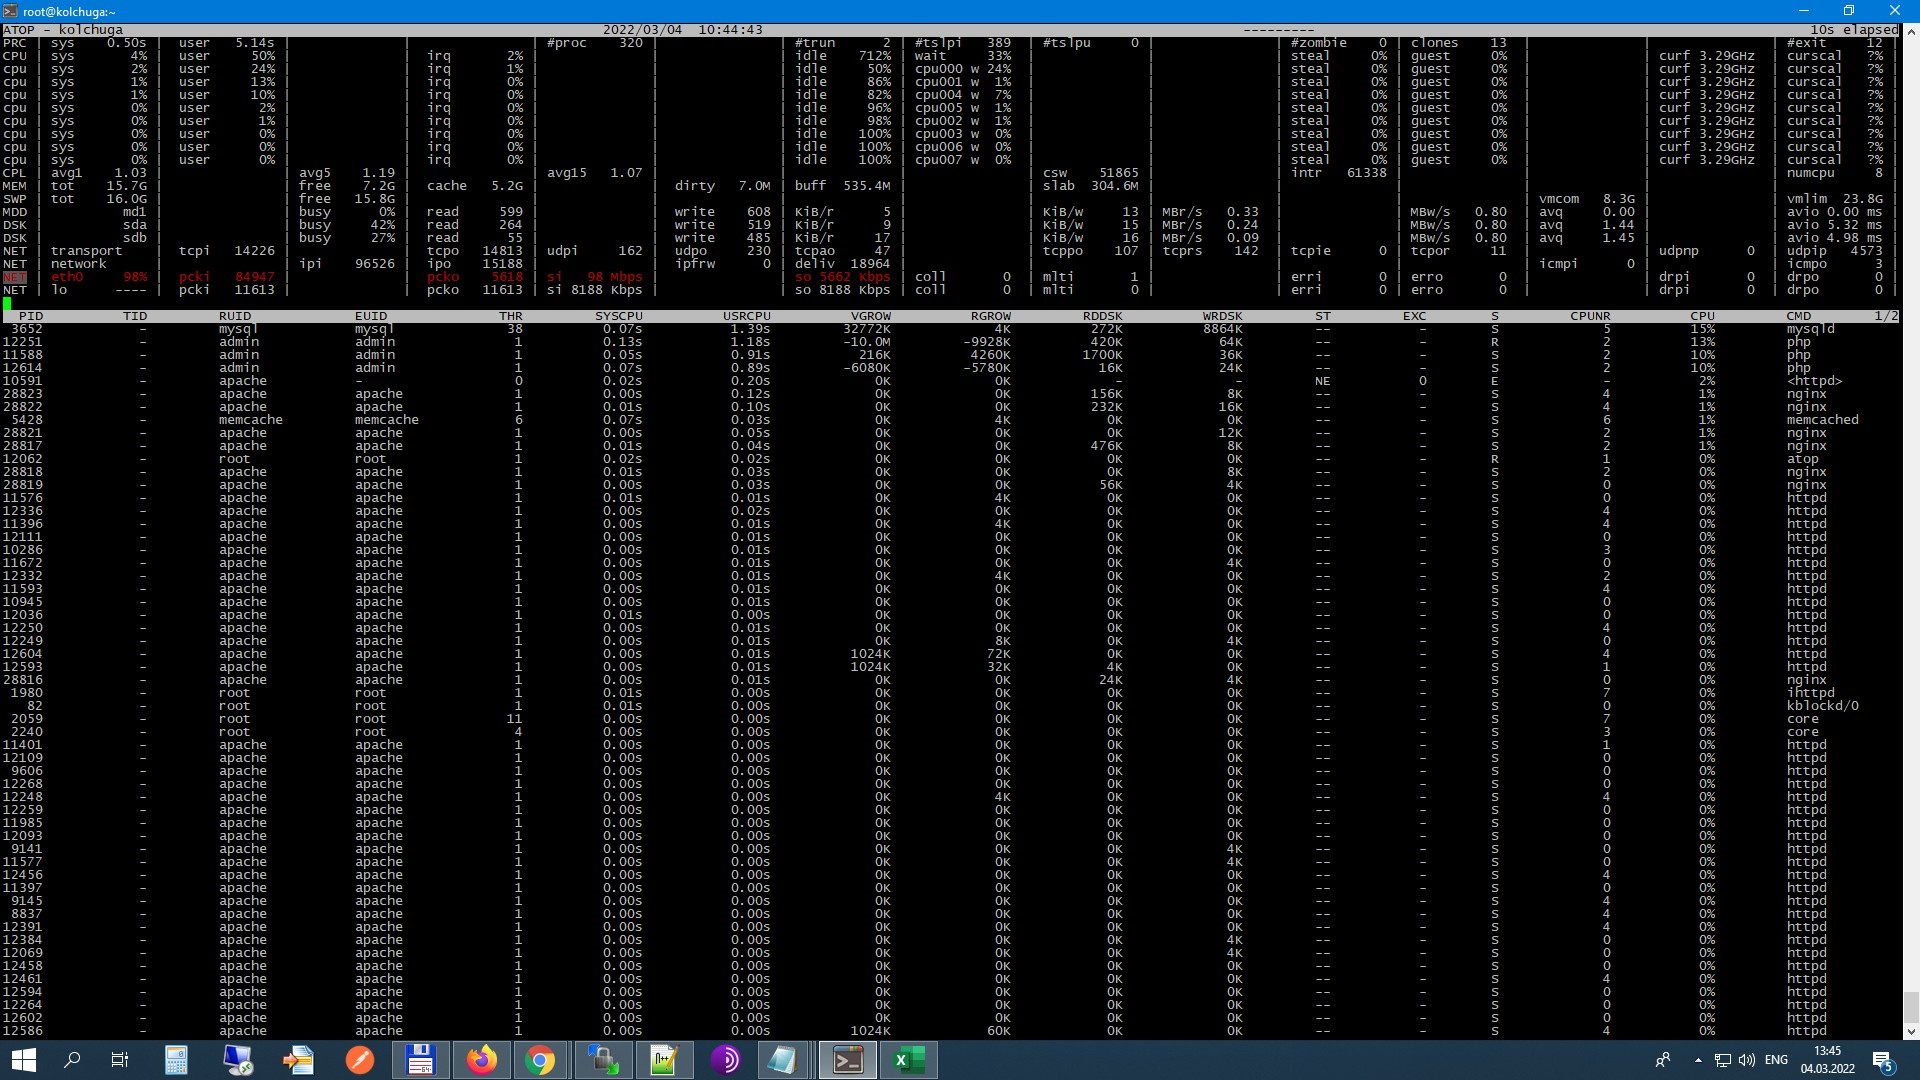
Help me figure out what's going on, why it's highlighted in red.
Answer the question
In order to leave comments, you need to log in
Monitoring should be comprehensive. You have just found the hero of the occasion - now it's time to get into the guts of the DBMS, track queries, if necessary, profile or dig towards the application that generates these queries.
Or maybe you just have a shitty DBMS, who knows.
Then you need to switch to the MySQL monitoring tools.
The culprit could be a query like
without .
If there are a large number of entries, the entire channel can be clogged.
Such a request from a user with sufficient privileges will show what current requests are taking a long time and what is being done at that moment, including data transfer operations over the network.select * from users
show full processlist
Didn't find what you were looking for?
Ask your questionAsk a Question
731 491 924 answers to any question