Answer the question
In order to leave comments, you need to log in
How to understand the output of the Unity profiler?
Good afternoon!
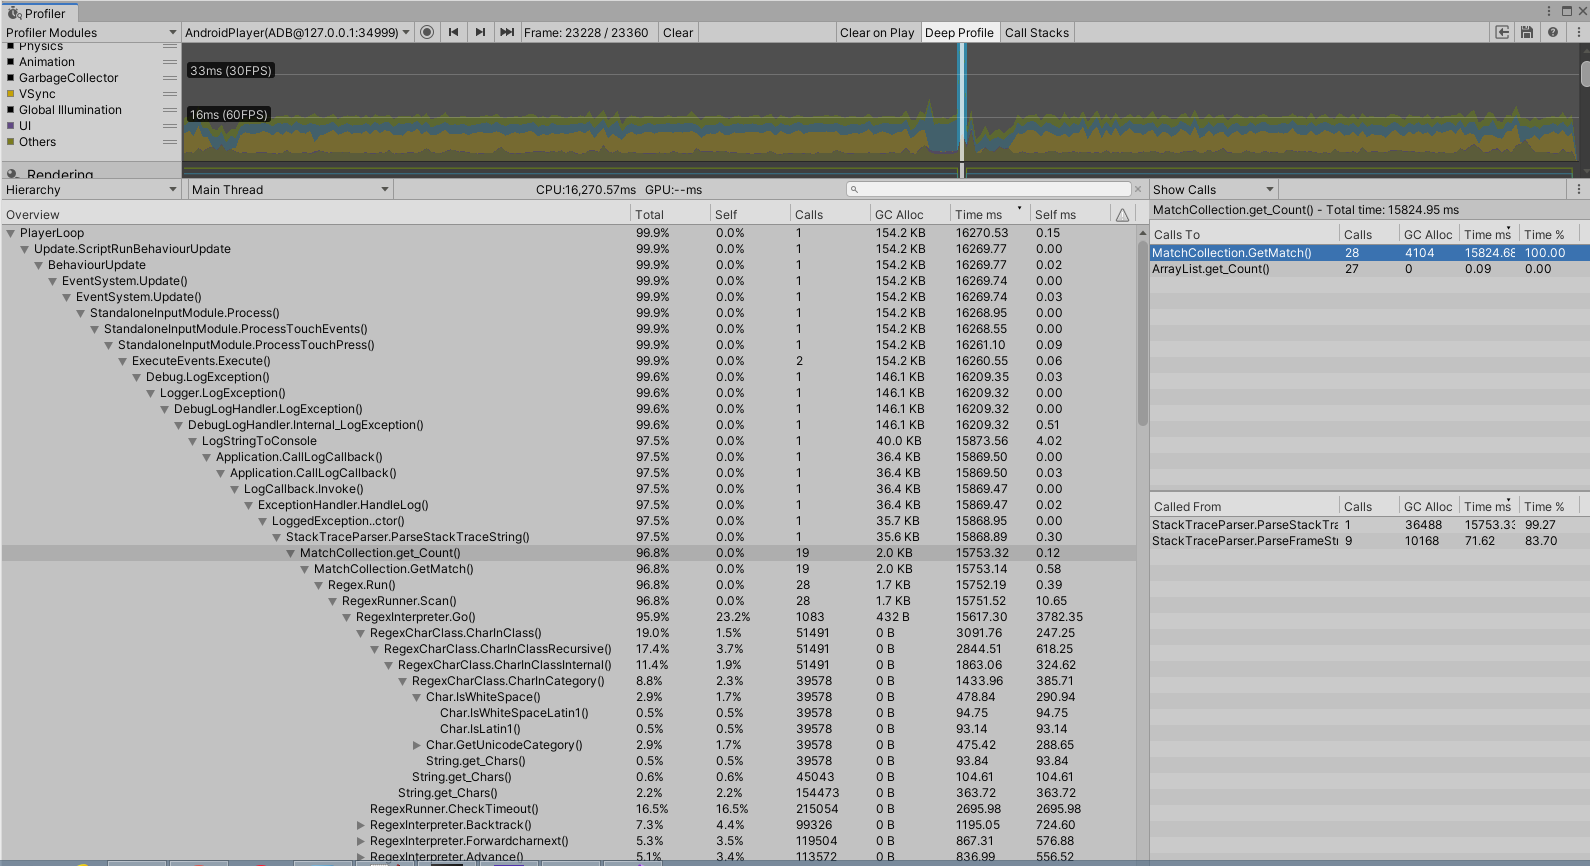
The program developed in Unity slows down (freezes for a few seconds when one of the scripts is launched) on an old Android device (Samsung J1 mini). Works fine on newer ones. I decided to try to figure out where the bottleneck is. Launched a profiler and understood nothing. ((
Firstly, the profiler itself hangs along with the device, and after hanging some particularly high load peaks, I don’t see it. At the moment of freezing, the profiler gives me this picture:

Is it possible to understand from this what specifically caused the hang, Or which way to dig?
Answer the question
In order to leave comments, you need to log in
Didn't find what you were looking for?
Ask your questionAsk a Question
731 491 924 answers to any question