Answer the question
In order to leave comments, you need to log in
How to take Fourier transform from discrete points?
Temporal data is simply a count of time, the moments at which an event occurred. Eg. events are marked at 1st second, 3rd, 5th, etc.: t = [1, 3, 5, 7, 9].
What is the right way to get the frequency spectrum of this data? I expect that the peak at amplitude "2" should come out.
Tried to choose a certain sampling rate, for example. with a step of 0.5 seconds, and make a comb from "0", and where there were events - "1". And take from this set fft()
But it turns out not at all what I expected: 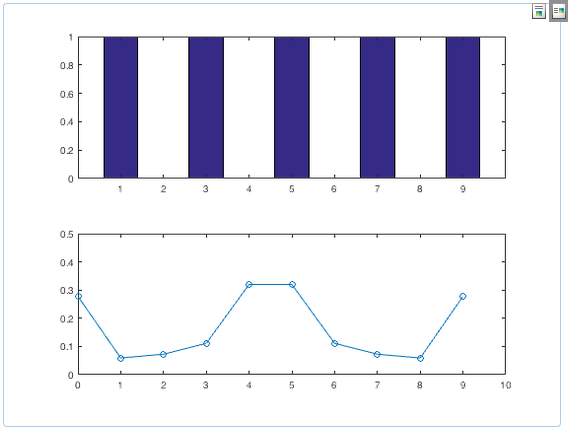
My Matlab code of this attempt:
A=[1,3,5,7,9];
subplot(2,1,1);
B = zeros(max(A),1);
B(A) = 1;
bar(B);

dx = 0.5;
X = zeros( round( max(A) / dx) - 1, 1);
X( round(A / dx)) = 1;
t = 1:length(X);
Y = fft(X);
P2 = abs(Y/length(X));
L = length(X);
P1 = P2(1:L/2+1);
P1(2:end-1) = 2*P1(2:end-1);
f = 0:L/2;
subplot(2,1,2);
plot(f,P1,'o-');
axis([0 10 0 0.5]);Answer the question
In order to leave comments, you need to log in
> What is the right way to get the frequency spectrum of this data?
The spectrum is always frequency, and oil - oil
> I expect that a peak should come out at amplitude "2".
It's not at all clear what it means
. Look: you have some discrete events that occur at arbitrary moments in time, for example, you sit under an apple tree and, when an apple falls, you mark the time. And you want to understand something about the periodicity associated with these events.
The first is time frames. In addition to the time of the fall of the first and last apple, the moments of the beginning and end of observations will be needed. Let it be 00:00 and 24:00.
Second. The discrete fourier transform works with periodic samples, for example, how many apples fell in every hour during the day (those 24 samples). FFT is an algorithm that requires the number of samples to be a power of two (in my example, I will take 32 samples for 45 minutes).
Third. If there are few apples falling, but you want to get the most out of the experience, you can try interpolation, for example, if 1 apple fell at 12:30, this can be interpreted as follows: 1/3 of the apple fell at 12:00 and the rest at 12:45 2/3. For correct interpolation at the edges of the time range, it would be nice to grab 45 minutes of observations before and after.
I won’t tell you about Matlab, but in Python it’s done like this:
import numpy
import scipy.fftpack
x = numpy.array([0, 1, 0, 1, 0, 1, 0, 1, 0, 1])
numpy.abs(scipy.fftpack.fft(x)[:(len(x)/2)]) * (2./len(x))array([ 1., 0., 0., 0., 0.])- here you can see the only peak at the highest frequency n, lower and lower frequencies by zeros. x = numpy.array([0, 0, 0, 1, 0, 0, 0, 1, 0, 0, 0, 1])array([ 0.5, 0. , 0. , 0.5, 0. , 0. ])- there are two equal peaks on nand on n/4, the latter obviously follows from the data, the first from the fact that the figure of the original signal is far from a sinusoid.
I have not practiced Matlab for a long time. 10 years :) I forgot everything.
But I will say this - the Fourier transform should give you a complex number, respectively, you need to observe the peak on the frequency response (the modulus of the complex number).
Then your signal is a meander.
Maybe this will help: https://habrahabr.ru/post/219337/
Didn't find what you were looking for?
Ask your questionAsk a Question
731 491 924 answers to any question