Answer the question
In order to leave comments, you need to log in
How to 'smooth' graphs using the Daubechies wavelet transform?
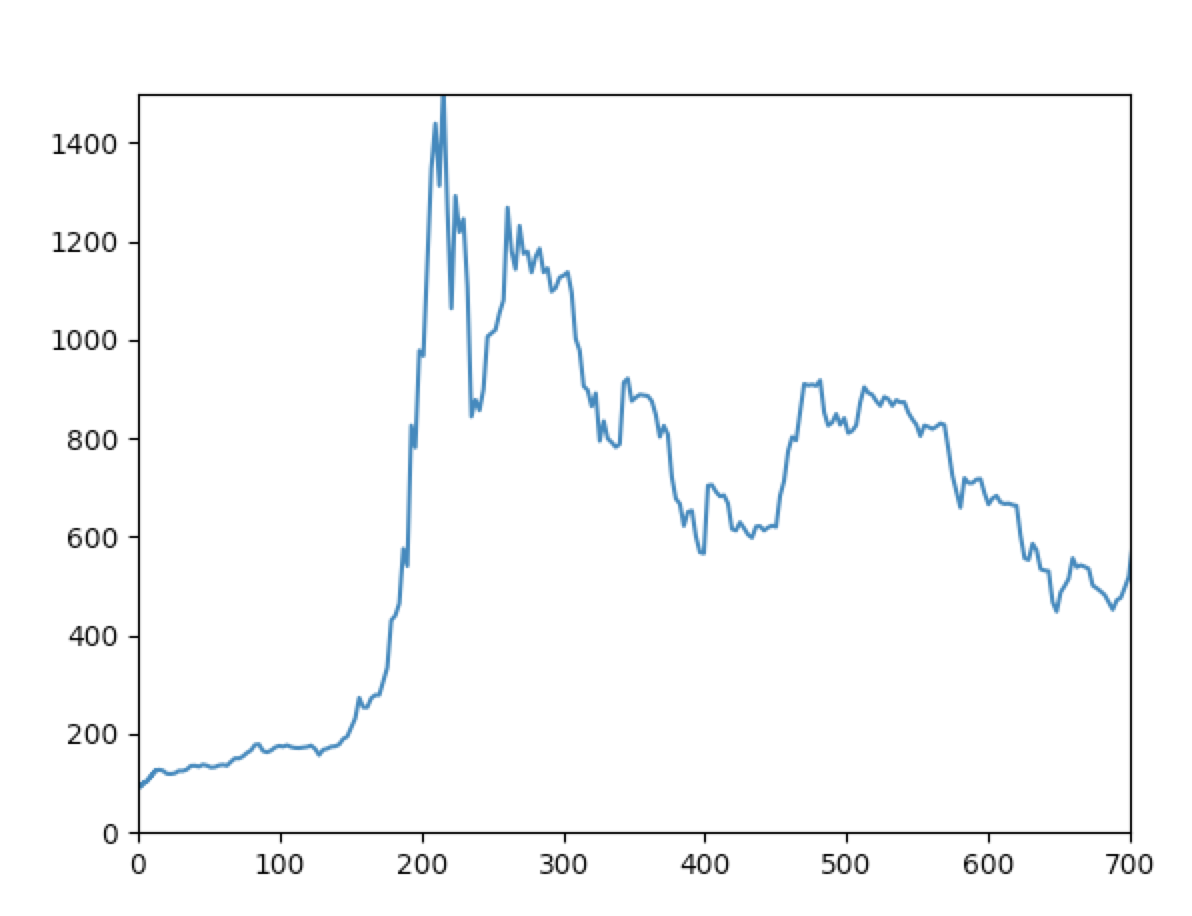
In general, in matlab there is such a function as dbaux and wavelet tools (or something like that), I want to say right away that it builds everything correctly, but this does not suit me because I need a solution on python. I actually found the PyWavelets module , and it seems to be working correctly (the values with dbaux from Matlab coincided), in fact, the question is, why did the graph shift significantly up?
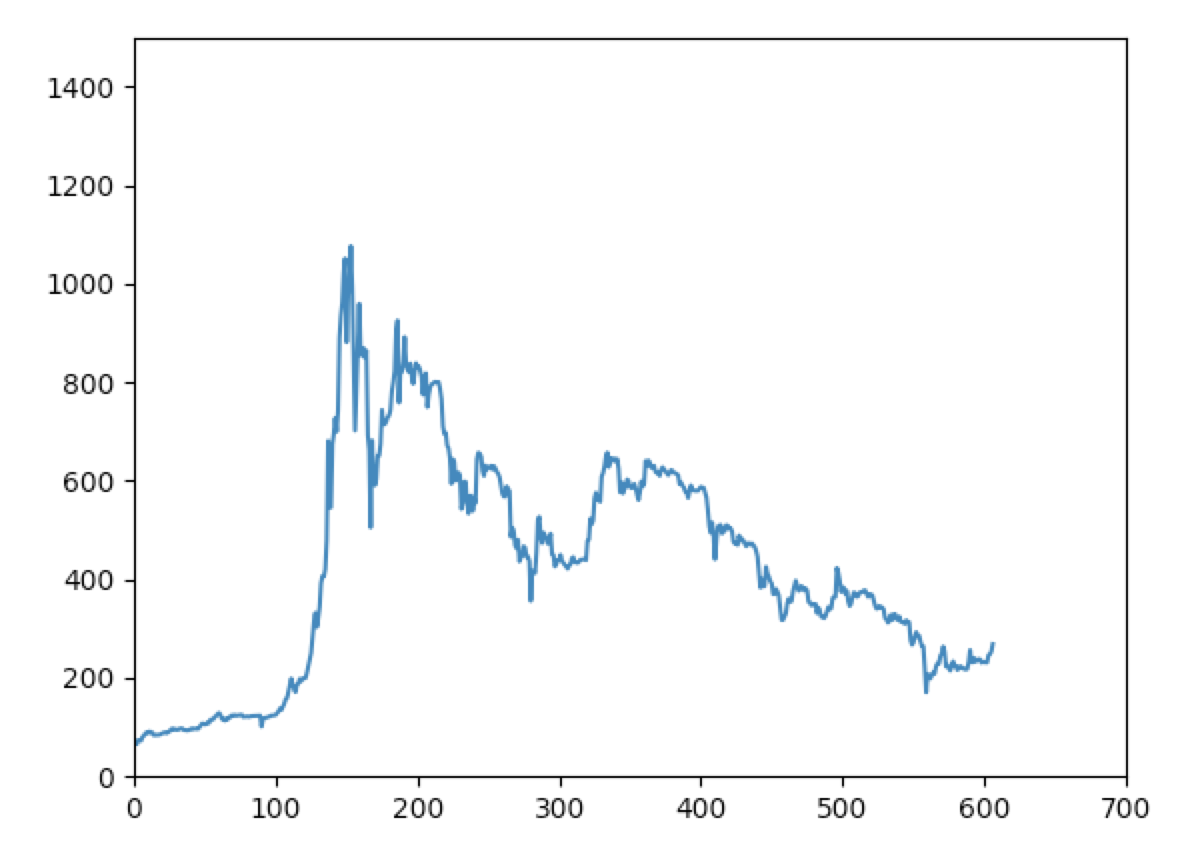
Graph before transformations: 
Graph after transformations: 
Ps maybe I'm doing something wrong, I'll write a little more. There are 2 lists (x, y), each of which I decompose according to the Doybeshi transform
cA1, cD1 = pywt.dwt(list1, 'db6')
cA2, cD2 = pywt.dwt(list2, 'db6')Answer the question
In order to leave comments, you need to log in
Didn't find what you were looking for?
Ask your questionAsk a Question
731 491 924 answers to any question