Answer the question
In order to leave comments, you need to log in
How to skip certain files and folders during debugging in Jetbrains products (WebStorm, PhpStorm)?
I will say right away that at the moment WebStorm is specifically interested, but if there is some kind of general solution, then of course it is interesting to listen to it. The situation is such that sometimes there are projects with a fairly large number of different third-party libraries, for example, the same React. It itself is quite voluminous, and eventually acquires a sufficient number of additional packages around itself, which leads to problems at the time of debugging.
The problems are such that when we start debugging the code of our project directly, the debugger constantly jumps into the libraries of certain packages, the logic of which is completely uninteresting to watch in 95% of cases. I tried to find the answer myself, came across the following settings:
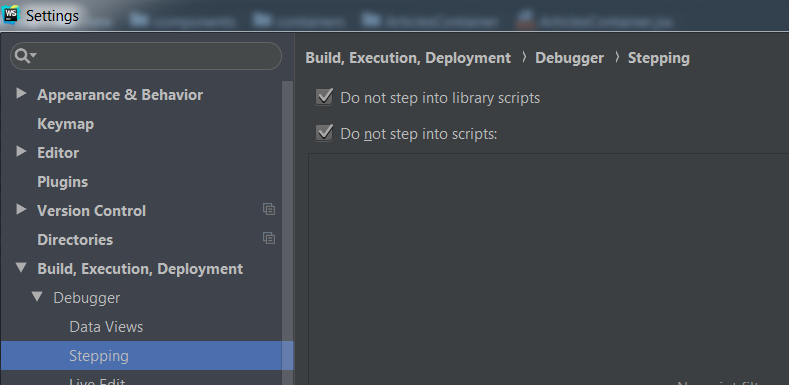
For the sake of experiment, I tried to add the name of some script to this list that I would like to skip, but it didn’t work, maybe it’s worth specifying class names here, but even if this turns out to be a working option, it’s impossible to specify everything here due to the size of the node_modules folder " uninteresting".
I turned to the first checkbox in the screenshot above, it is supposedly responsible for these libraries:
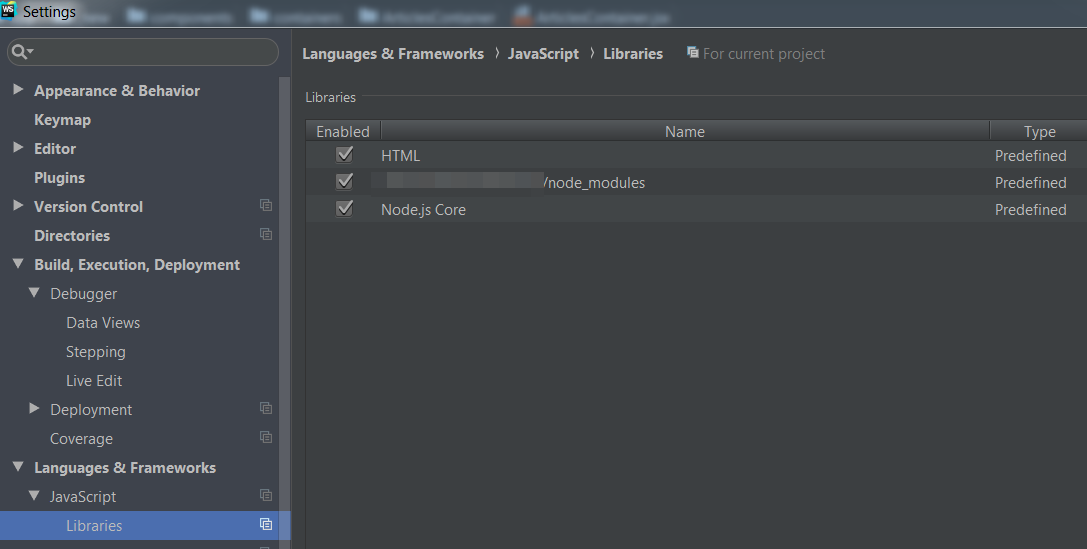
And these are the Spopes settings:
As you can see, they all seem to be taken into account (and therefore everything that is in the node_modules folder), but nevertheless the situation persists . When debugging and using Step Over (F8), I still start running through all the libraries that are in node_modules.
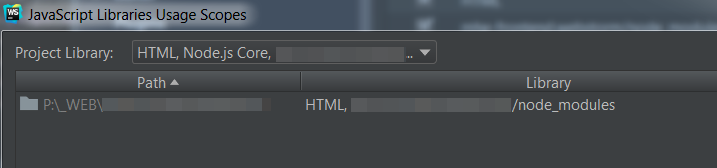
At the same time, I don’t see any libraries from node_modules here, although I probably should:
Attention, question: how to properly configure the libraries (Javascript) of the project in WebStorm and how to configure the IDE itself so that when debugging I go through the steps only inside the logic of the project itself?
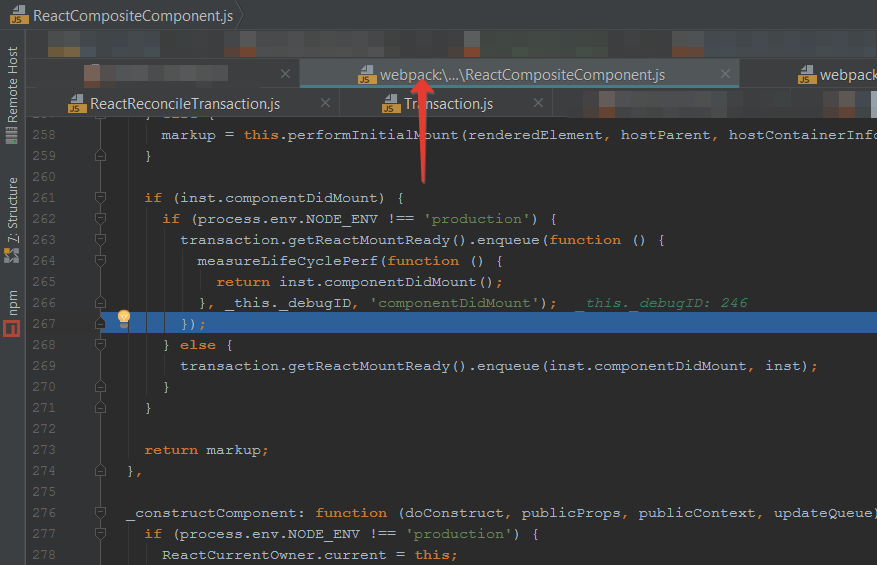
UPD : Now I noticed that in fact the files that are opened are located along the path like "webpack:\\...", so the IDE probably does not understand that they should actually be skipped? However, I specify the "--devtool source-map" option for webpack. But then it is not clear how and where to debug this at all:
Answer the question
In order to leave comments, you need to log in
I'll show you how I do it in PhpStorm
And PhpStorm no longer indexes these directories.
It seems to me that your process is initially built incorrectly.
You can both enter the function and go through it.
And entering framework methods while debugging is a common thing. As well as skipping the input to your methods.
Just use different buttons at the right time (step into or step over) depending on your needs.
Didn't find what you were looking for?
Ask your questionAsk a Question
731 491 924 answers to any question