Answer the question
In order to leave comments, you need to log in
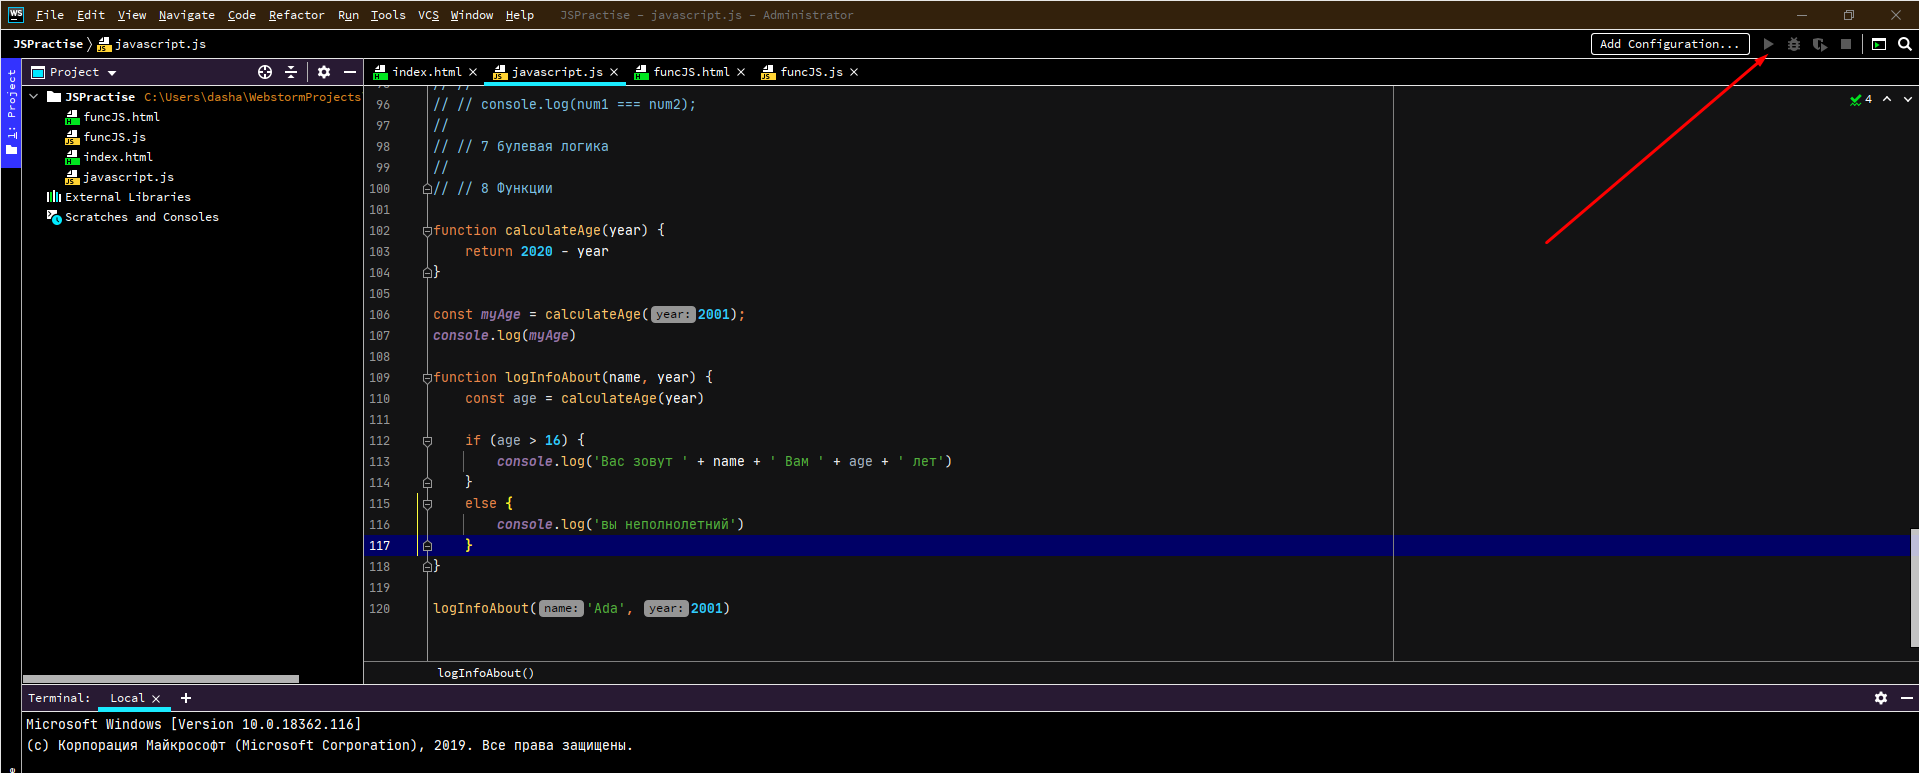
How to set up debug in Webstorm?
I'm trying to figure out how functions and loops work in JS, before that I watched how loops work in c #. If I'm not mistaken, it's very convenient to do this through the debugger. In it, you can see the sequential execution of a piece of code in steps, while it is highlighted.
The problem is that for some reason I can't enable the debugger in WebStorm.
This is probably a stupid question, but for some reason I can't figure it out, in advance, thanks for the answer.
Answer the question
In order to leave comments, you need to log in
The button is not available because no configuration has been created to run. Please refer to this article and create the configuration you need. There is also a good video "Debugging JavaScript in WebStorm" explaining the nuances.
Didn't find what you were looking for?
Ask your questionAsk a Question
731 491 924 answers to any question