Answer the question
In order to leave comments, you need to log in
How to set the scale on the axis in LiveCharts?
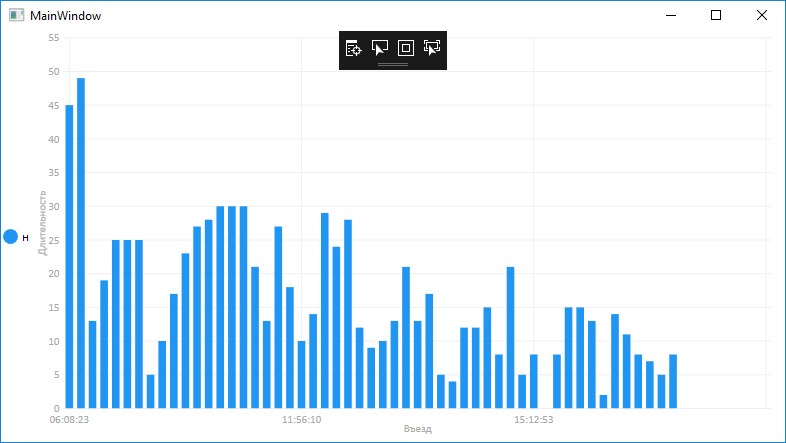
Good afternoon! I ask for your help in this matter: I build a graph from the values recorded in the database in two columns (0: the time when the event occurred (displayed in the HH: mm: ss format) and 1: the duration of this event), it turns out this: 
Scale along the axis X is arbitrary.
It is necessary to make a scale along the X axis in hours, from 0 to 24, in order to see the intensity depending on the time of day.
Tell me how can this be done? With all the richness of the description, I did not find the answer to this question :(
Answer the question
In order to leave comments, you need to log in
Didn't find what you were looking for?
Ask your questionAsk a Question
731 491 924 answers to any question