A
A
Alexander2020-12-07 12:51:27
excel
Alexander, 2020-12-07 12:51:27

How to select data scale in chart for formatting in Excel?

Hello!
Look, this is the situation:
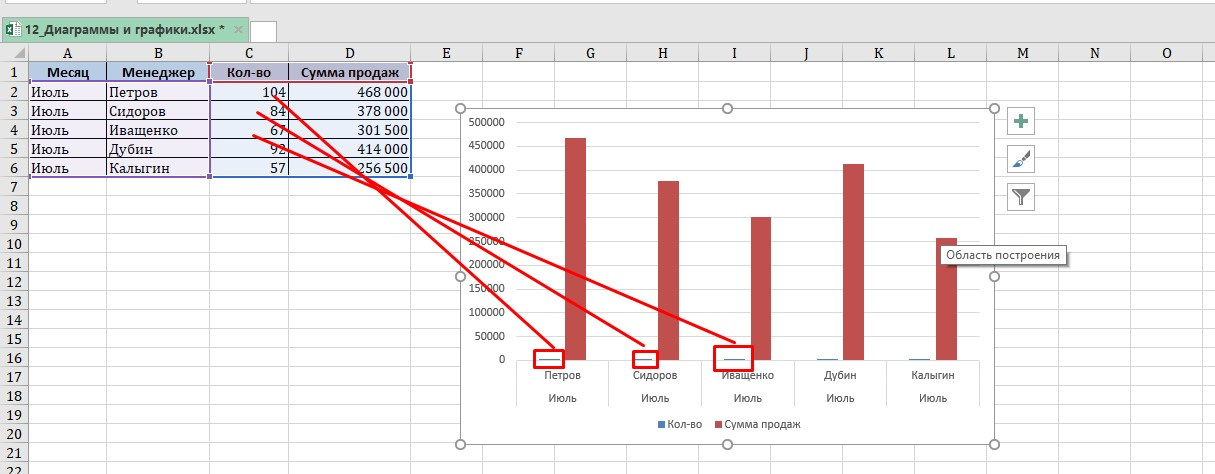
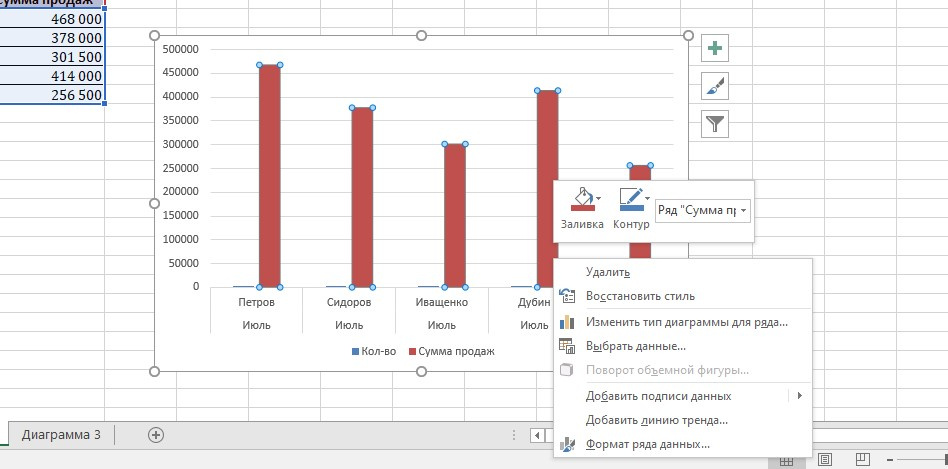
There is a graph built on a table with 2 columns of data.
In one column (the amount of sales ), the data is measured in hundreds of thousands (200,000, etc.) in the other ( number of goods ), in tens - (98, etc.).

spoiler
5fcdfab51124f225653975.jpeg

Due to such a difference in the values ​​on the graph, the " quantity of goods " scale is not visible and I cannot select it with the mouse button, such as the "sales amount" scale to select the format of the data series and put them on the auxiliary axis with an overlay.
spoiler
5fcdfb660fbef444031308.jpeg

Thanks

Answer the question

In order to leave comments, you need to log in

1 answer(s)
O
Oleg, 2020-12-07
@Oleg_F

If you understand the question correctly, and you only need to select a column, then being on the chart, you should have the Format tab.
5fce03978e06c311477684.png
On this tab, in the current fragment section, you can select the column you need
5fce036a1085c043996095.png

Didn't find what you were looking for?

Ask your question

Ask a Question

731 491 924 answers to any question