Answer the question
In order to leave comments, you need to log in
How to remove intermediate axis labels on a Plotly chart?
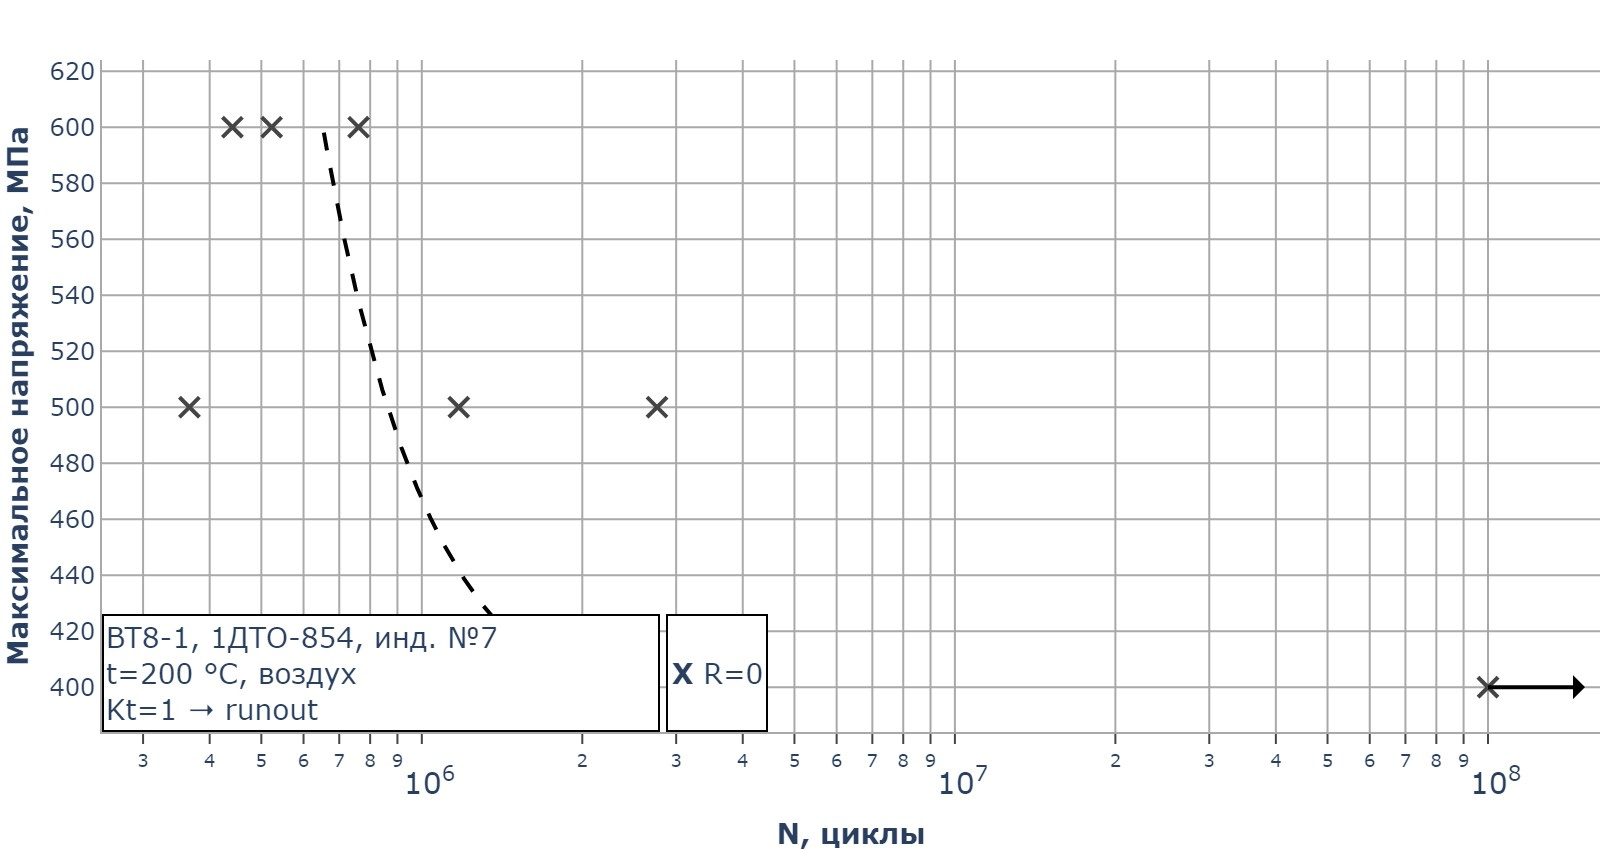
Hello. Question for the experts at plotly. I'm creating a fine-tuned chart. I created such a graph (see photo). on the logarithmic x-axis, I need to remove the small numbers between the major divisions while leaving the grid lines. I can remove these numbers with the dtick=1 attribute in the update_xaxes method of the Figure class from plotly.graph_objects, but then the lines will also be hidden. How can I do what needs to be done?
Answer the question
In order to leave comments, you need to log in
Try
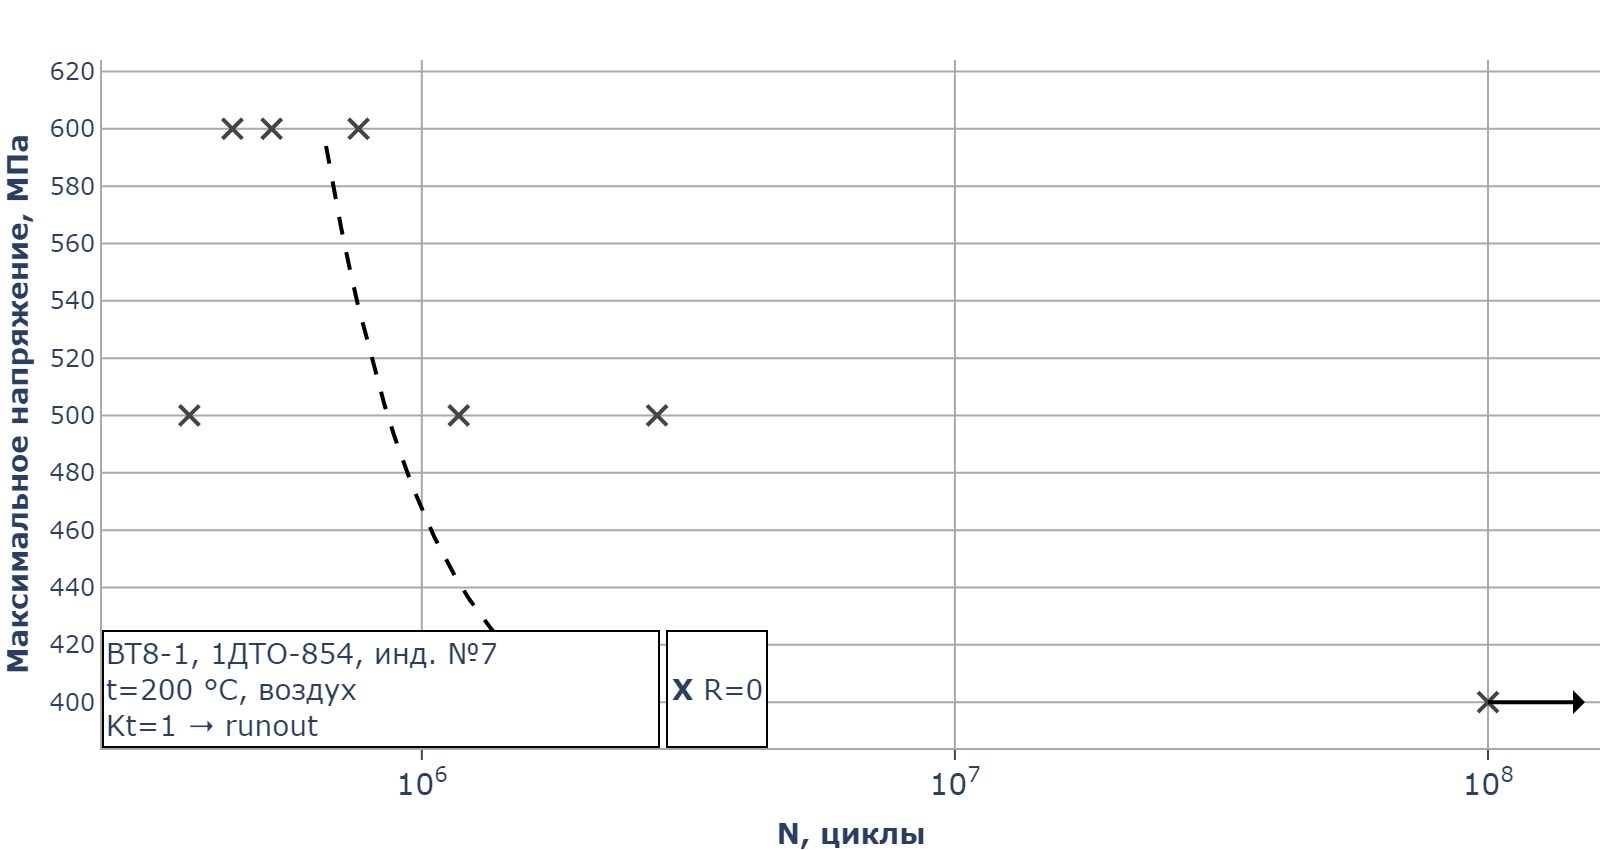
fig.update_xaxes(tickvals=[<ваши необходимые значения>])Didn't find what you were looking for?
Ask your questionAsk a Question
731 491 924 answers to any question