Answer the question
In order to leave comments, you need to log in
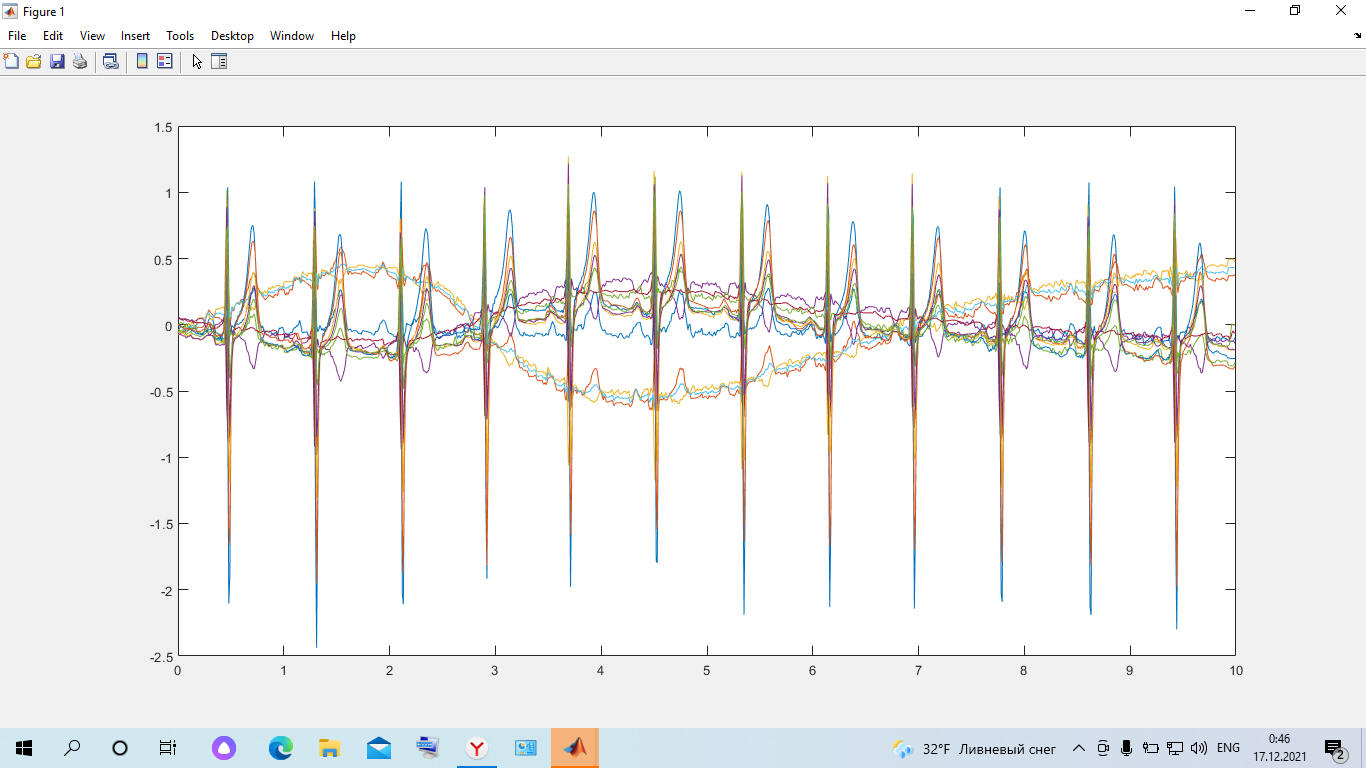
How to remove interference, network pickup and electrode movements on the chart?
In general, jumps in the graphs relative to the average value are visible. It interferes very much
Answer the question
In order to leave comments, you need to log in
It is not obvious from the graphs what is a useful signal and what is a hindrance.
If the interference is high-frequency (peaks interfere), then take the moving average.
If, on the other hand, the spikes are your signal and the noise is that slow swing that fits one and a quarter periods on the top chart, then subtract the moving average from the full signal [and add just the average].
https://ru.wikipedia.org/wiki/Moving_Average
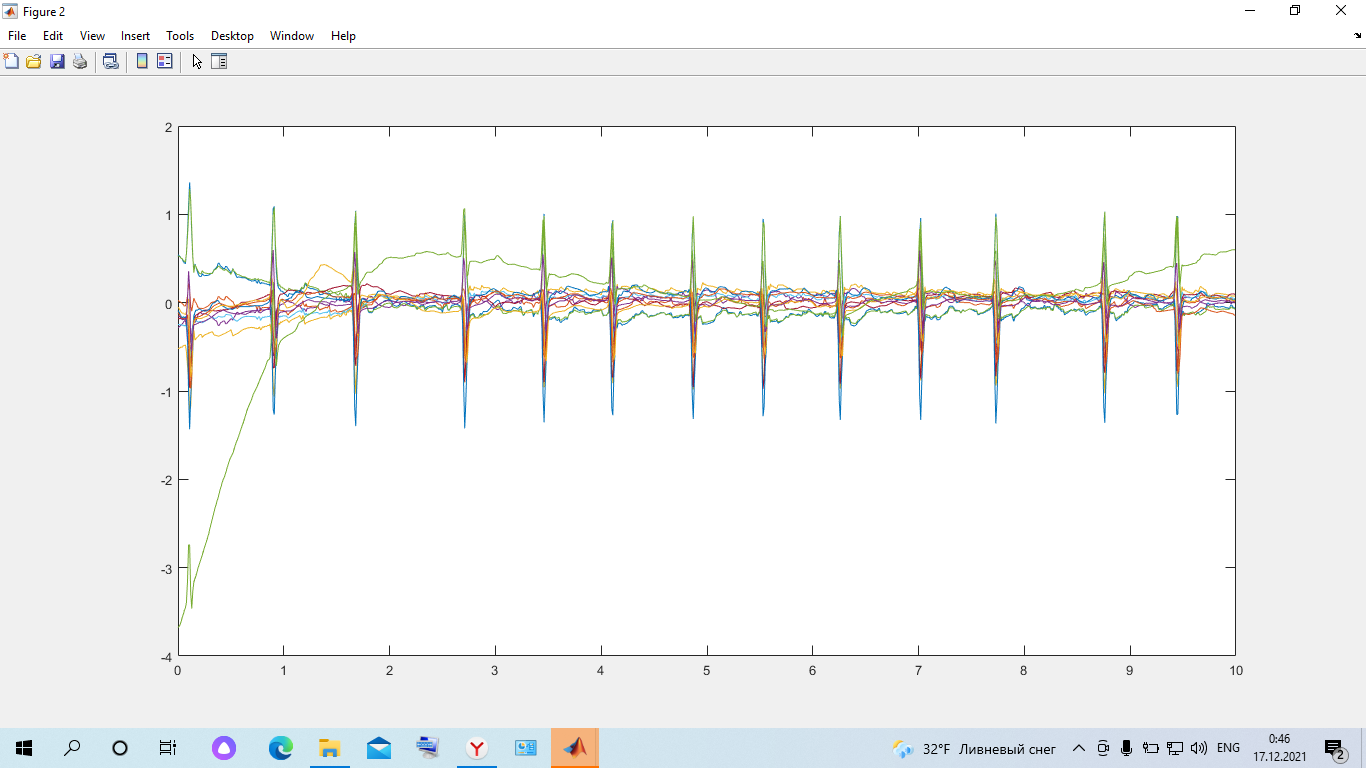
I want to add hint000 . It is enough to decompose your signal into the frequency spectrum, and then filter out unwanted frequencies. Judging by your graph, you will see separate lobes / delta functions in the spectrum, which means that the useful signal is in a strictly defined frequency band.
It may even be enough for you to apply a ready-made band pass filter or high / low pass filters by the selection method.
Didn't find what you were looking for?
Ask your questionAsk a Question
731 491 924 answers to any question