Answer the question
In order to leave comments, you need to log in
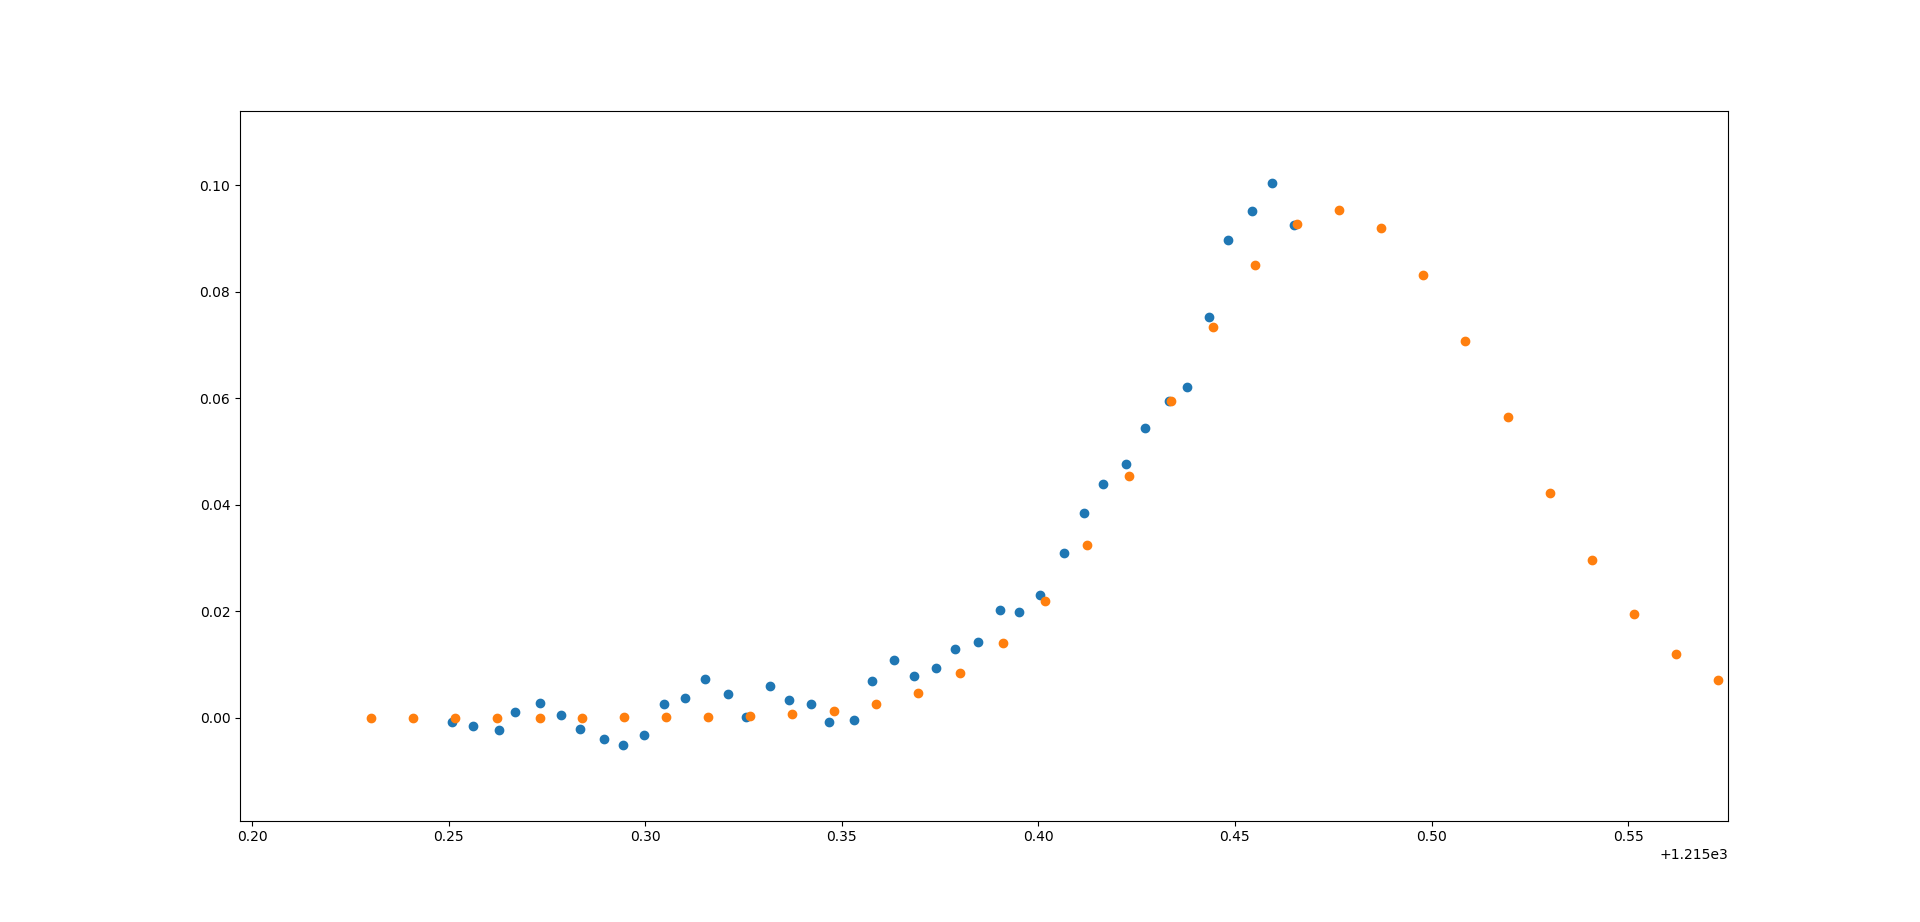
How to remove extra points from a file so that it contains only the nearest points to the points of another file?
Good afternoon.
I'm having a problem finding the point closest in x and filtering those points. Those. from the model graph, you need to remove all those that do not have the closest one from the experiment.
f = open('model.dat', "r", encoding="utf-8")
model = []
for i in f:
    model.append([i.split()[0], i.split()[1]])
f.close()

f = open("data.dat", "r", encoding="utf-8")
data = []
for i in f:
    data.append([i.split()[0], i.split()[1]])
f.close()

b = data
m = len(b)

for i in range(len(b)):
    b[i] = [i + 1, b[i]]
b.sort(key=lambda x: x[1])


def find_value(x):
    if x < b[0][1]:
        return b[0][0]
    if x > b[-1][1]:
        return b[-1][0]
    l = 0
    r = len(b) - 1
    while r - l > 1:
        m = (r + l) >> 1
        if b[m][1] < x:
            l = m
        else:
            r = m
    if x - b[l][1] < b[r][1] - x:
        return b[l][0]
    else:
        return b[r][0]


print(*[find_value(v) for v in model])Answer the question
In order to leave comments, you need to log in
First, where did you find the graph here? There are just two sets of 2D points. And no more.
Secondly, do you think that we are able to guess what "error for setting the model graph" the interpreter gives you?? What is a "task"???
Thirdly, did you open the files, but did you forget to read some of them?
Fix it, show what happened there and come for further advice.
PS And in general, if you think about it, then the tasks are formulated incorrectly. In the model series, ALL points have the nearest x from the data series. Another thing is how far these points are from each other.
And your graphs, or rather their meaningful part, look like this:

Didn't find what you were looking for?
Ask your questionAsk a Question
731 491 924 answers to any question