Answer the question
In order to leave comments, you need to log in
How to profile php on 1s-Bitrix using XHProf?
Hello.
In order to identify and eliminate "poor-quality" code, I decided to install XHProf.
I collected data, but I do not know how to work with them. All slow functions are connection of components, such as CAllMain::IncludeComponent, CBitrixComponent::includeComponent and so on. Failed into nested functions there are the same component calls everywhere.
I expected to find the shit code written by the programmers of this project, and not delve into the Bitrix core.
Maybe I chose XHProf in vain?
Is it possible to look for bottlenecks on Bitrex better than other methods?
Answer the question
In order to leave comments, you need to log in
The profiler is already a scalpel, to find a specific problematic piece of code, set it on the whole hit - a dubious solution that will result in the problems you have encountered.
Localize the problem and collect data by the profiler already inside the component. But from experience, it really needs a percentage in 10 cases.
Start with the built-in debugger.
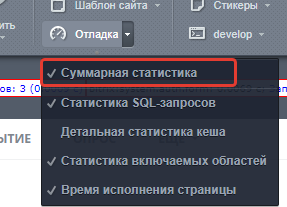
Look at the number of requests with and without cache, the execution time. In the same place you will see which components allow themselves a lot, and there, if necessary, run the profiler. Although most likely, you will see the problem before it starts.
Didn't find what you were looking for?
Ask your questionAsk a Question
731 491 924 answers to any question