Answer the question
In order to leave comments, you need to log in
How to plot a specific plot in python matlab?
You need to make a graph, with a division in the middle into parts of different colors. An example in the photo. You need to specify the percentage of black and blue parts, as well as the height
Answer the question
In order to leave comments, you need to log in
Firstly, the "PYTHON", "MATLAB" tags are, as it were, different tools. And the ways of drawing in them are somewhat different. You need to draw in both systems at once - then I don’t know,
And if only in Python, then something like this:
import numpy as np
import matplotlib.pyplot as plt
x=np.linspace( -2*np.pi,2*np.pi,100)
y1=1/(1+x**2)
y2=np.cos(x)**2
y3=np.exp( -x**2/10)
z=2*(y1+y2+y3)
plt.stackplot(x,y1,y2,y3)
plt.plot(x,z,'k', linewidth=4)
plt.xlim( -2*np.pi , 2*np.pi)
plt.grid(True)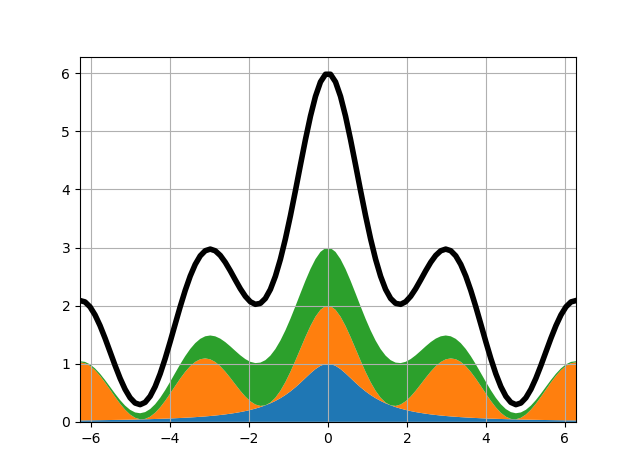
Didn't find what you were looking for?
Ask your questionAsk a Question
731 491 924 answers to any question