Answer the question
In order to leave comments, you need to log in
How to plot a function in Matlab?
Hello, unfortunately I do not have seven stars in my forehead. I was given a task and found a ready-made code for this task only for another option. Help to substitute the formula for my variant. I would be very grateful
. Here is what they ask to do:
Create two scenarios for plotting, designing and displaying a graph:
1. One option should use the standard approach for conventional programming languages using loop operators and conditional operators for element-by-element processing of arrays.
2. Another option is to use the operation of forming a range of values and the extended capabilities of MatLab operations and functions for group processing of arrays.
3. Display both graphs in one window, choose such output parameters that allow you to better see the course of the graph curve.
4. Consider the parameters for displaying graphs (color, lines, point design, axis labels, legend). Make your own schedule.
My task 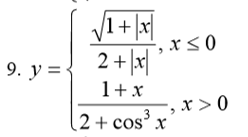
All I could do was write and I don’t know if it’s right or not.
y(i) =   sqrt(1+abs(x))/(2+abs(x));
    else
        y(i) = (1+x)/(2+(cos(x))^3);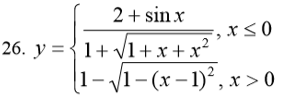
% Задание 5
% Построить график функции
clc
clear
a=input('Введите a=');
h=input('Введите h=');
n=input('Введите n=');
for i = 1:n
    x(i) = a + h*(i-1);
    if x(i)<=0
        y(i) = 2+sin(x(i))/(1+sqrt(1+x(i)+x(i)^2));
    else
        y(i) = 1-sqrt(1-(x(i)-1)^2);
    end
end
plot(x,y), grid on
title('Поэлементная обработка')
xlabel('x')
ylabel('y')


% используем мощщь матлаба
x = -5:h-5+n*h);
y = (1 + (3+x)./(1+x.^2)).*(x<=0) + ...
    sqrt(1+(1-sin(x)).^2).*(x>0);
figure
plot(x,y), grid on
title('Групповая обработка массивов')
xlabel('x')
ylabel('y')Answer the question
In order to leave comments, you need to log in
Didn't find what you were looking for?
Ask your questionAsk a Question
731 491 924 answers to any question