Answer the question
In order to leave comments, you need to log in
How to plot a function in excel?
Hello! Please help me plot a function in excel!
There is a mathematical formula, it needs to be translated into an excel formula!
Answer the question
In order to leave comments, you need to log in
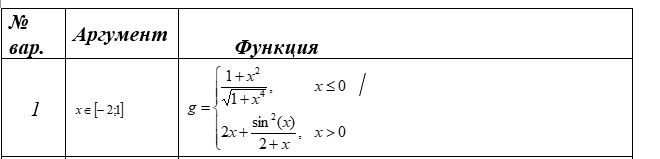
A1:A31 are filled with numbers from -2 to 1 in increments of 0.1
B1:
=если(a1<=0;(1+a1^2)/(корень(1+a1^4));1*a1+((sin(a1))^2)/(2+a1))Didn't find what you were looking for?
Ask your questionAsk a Question
731 491 924 answers to any question