Answer the question
In order to leave comments, you need to log in
How to make two charts on one field in Chart.js?
There is angularjs + chart.js
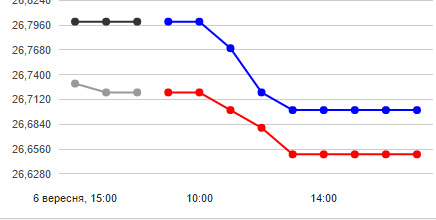
We draw a graph of the exchange rate, from the base we get the time and what the exchange rate is at a given time + the last two values for yesterday. It is necessary to display two values for yesterday on one graph, and then separating the remaining values for today with a "space". The graph is linear.
I now get solid lines.
An example as I would like (or should I use another library?!):
Answer the question
In order to leave comments, you need to log in
As I understood from the documentation, you need to do something like this
var chartInstance = new Chart(ctx, {
    type: 'line',
    data: [
      {}, // dataset 1
      {} // dataset 2
    },
    options: {
        responsive: false
    }
});Didn't find what you were looking for?
Ask your questionAsk a Question
731 491 924 answers to any question