Answer the question
In order to leave comments, you need to log in
How to make the graph display?
https://docs.google.com/spreadsheets/d/1GP-U3daCDn...
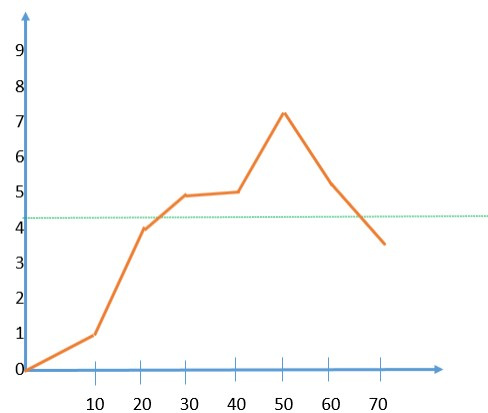
A24 - graph - I can't get the countdown to start from zero, and then 10,20,30,40,50,60,70 .
Why is the chart not showing up?
Please help me with the settings.
Everything seems to be the same as in the previous one, but it is not displayed.
What data is being built is highlighted in red.
It should be like this:

And also make horizontal level 4 green, is that possible?
Answer the question
In order to leave comments, you need to log in
Very confusing. Separate the task into a separate Table.
Usually such problems arise in the following cases:
Didn't find what you were looking for?
Ask your questionAsk a Question
731 491 924 answers to any question