Answer the question
In order to leave comments, you need to log in
How to make a scatter plot that updates?
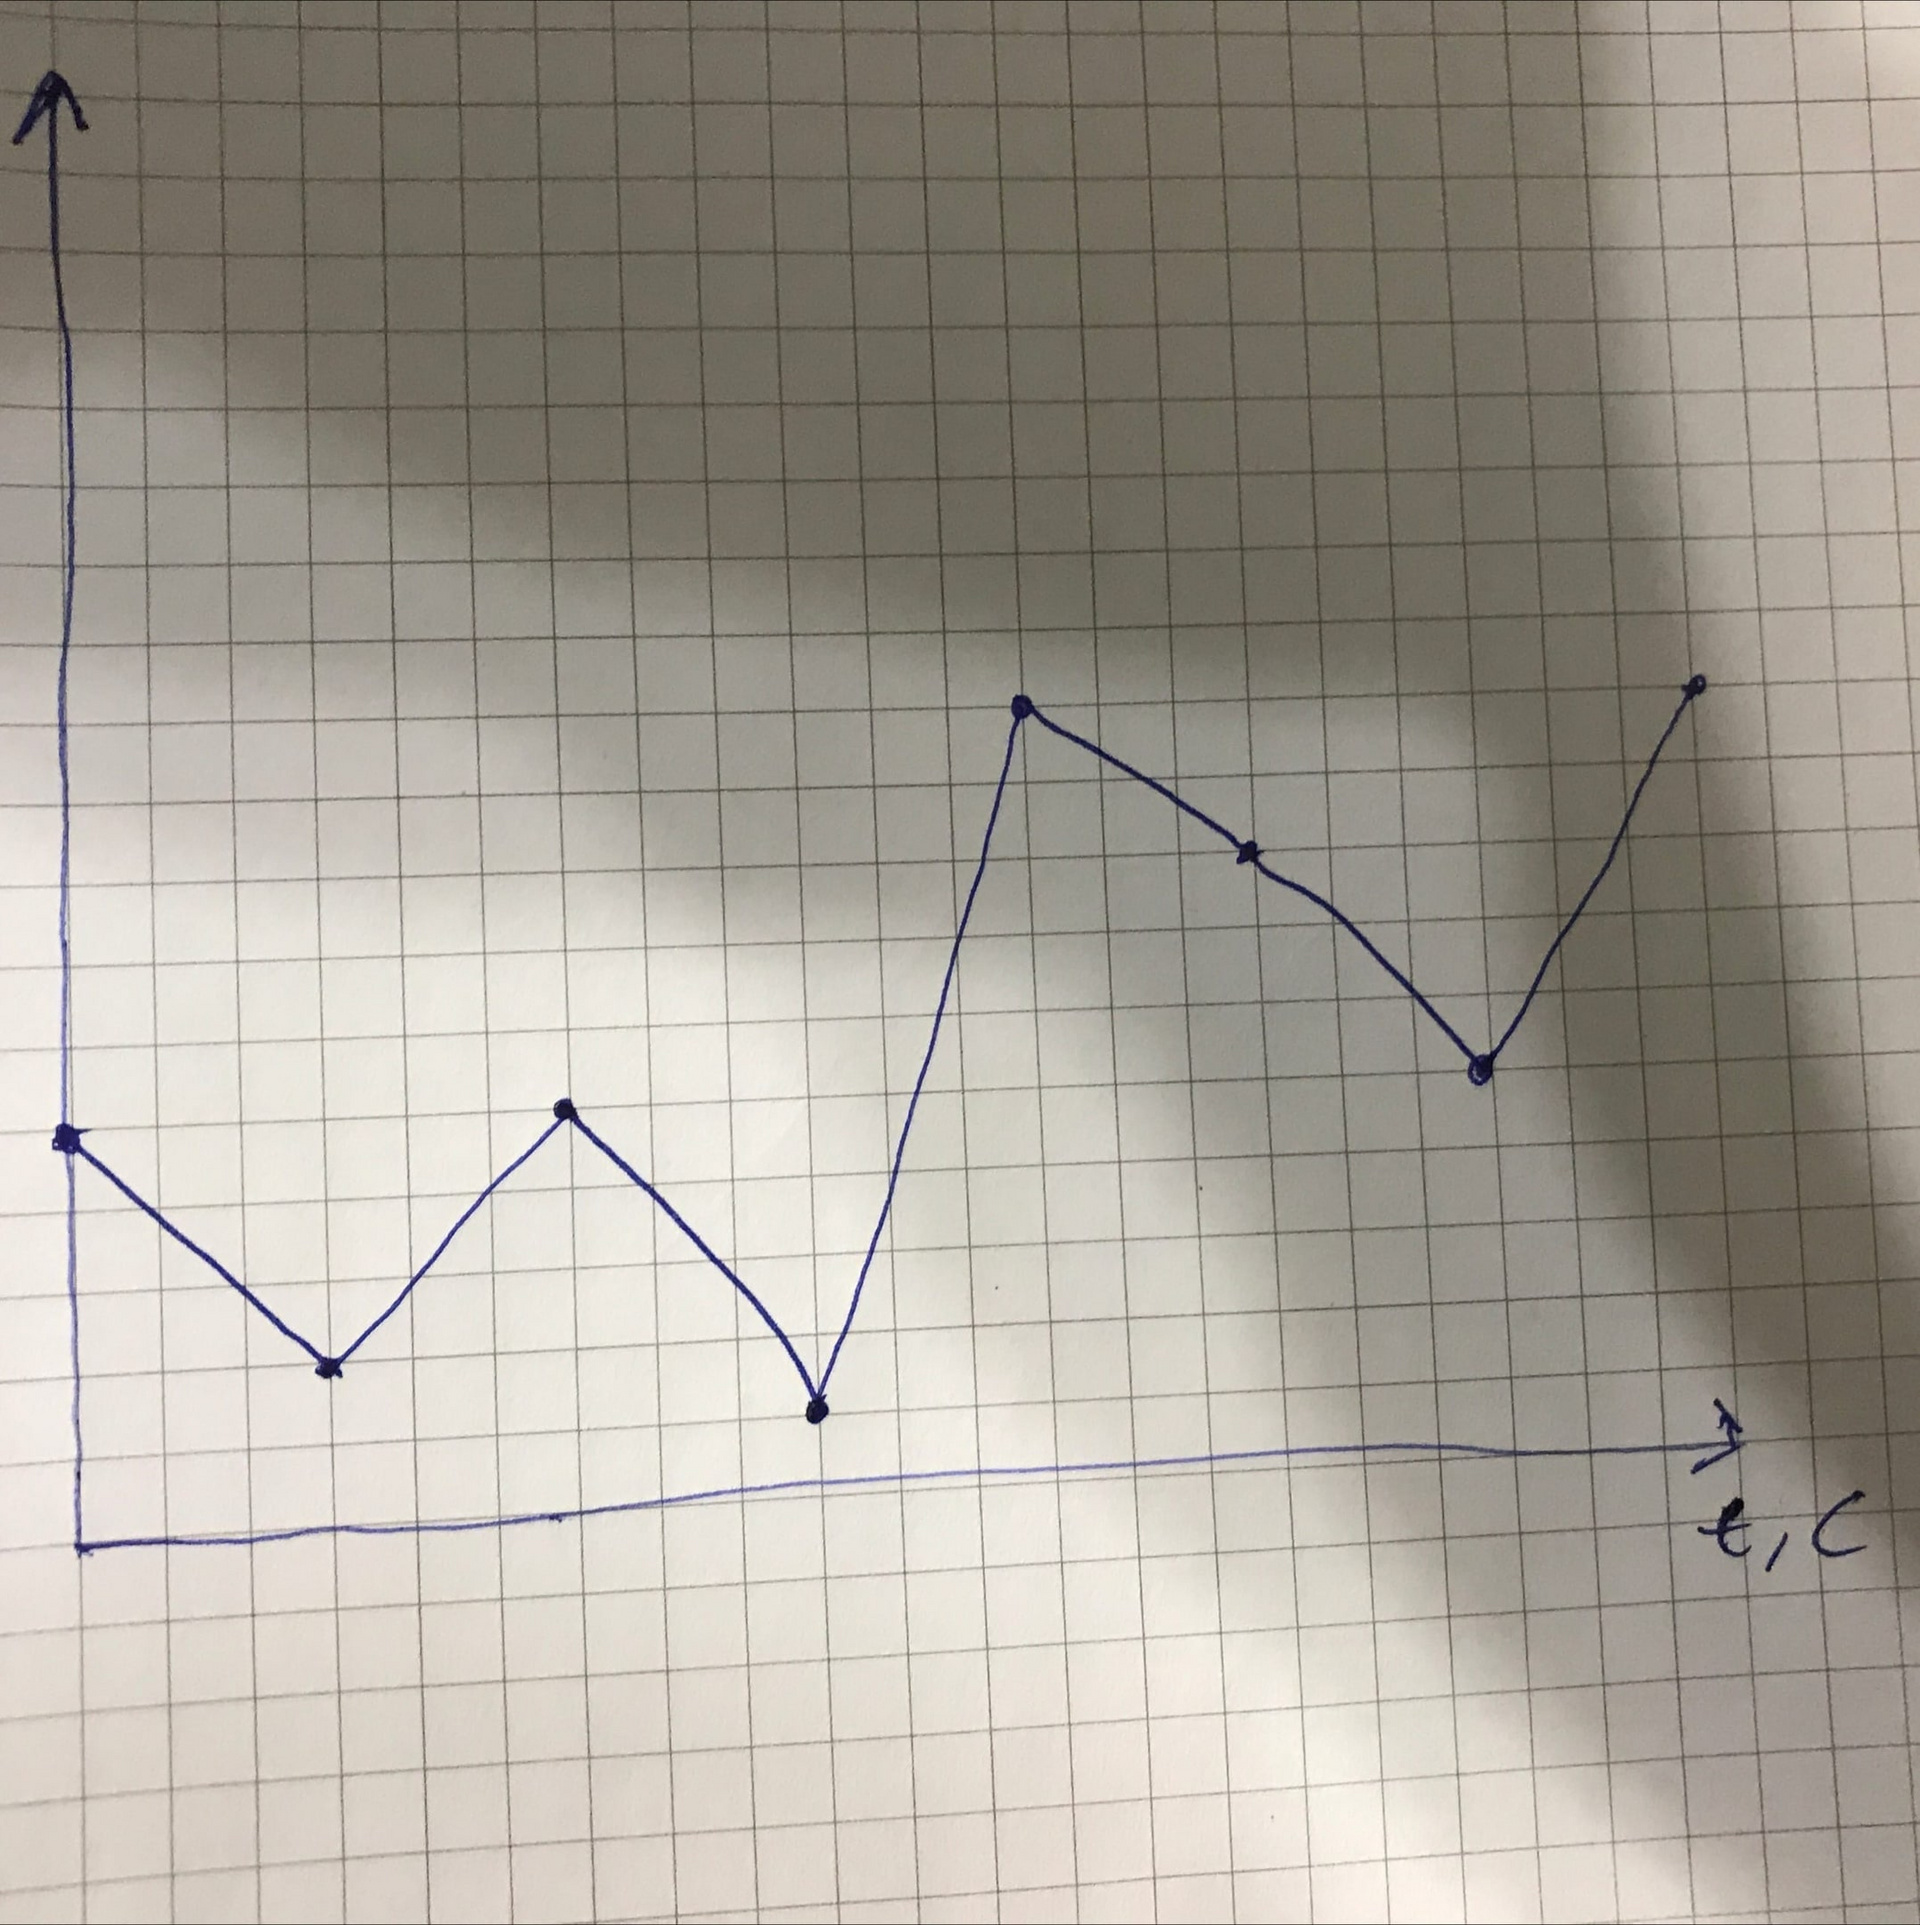
Every 3 seconds a random number is generated. The x-axis of the graph is time in seconds and the y-axis is these numbers. The graph should be updated in real time, and the points should be connected by lines. An example chart is below. Thanks for the help.

Answer the question
In order to leave comments, you need to log in
The easiest way is using Canvas.
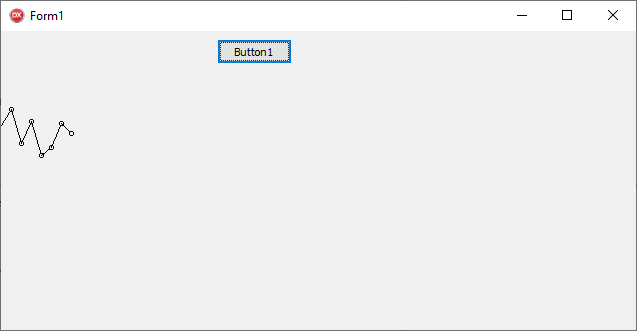
More or less like this:
//Добавление по кнопке
procedure TForm1.Button1Click(Sender: TObject);
var
  i: Integer;
begin
  //Смещение массива
  for i := 0 to 7 - 1 do
    Points[i] := Points[i + 1];
  //Добавляем в конец новое значение
  Points[7] := Random(40);
  //Перерисовываем окно
  Invalidate;
end;

procedure TForm1.FormCreate(Sender: TObject);
var
  i: Integer;
begin
  //Заполняем случайными значениями
  for i := 0 to 7 do
    Points[i] := Random(40);
end;

procedure TForm1.FormPaint(Sender: TObject);
var
  i, Offset: Integer;
begin
  with Canvas do
  begin
    //Смещение сверху
    Offset := 150;
    //Ставим начало рисования линии на ось Х и расположение первого элемента массива
    //10 - это интервал между точками
    MoveTo(0 * 10, Offset - Points[0] * 2);
    //Рисуем остальные элементы
    for i := 1 to 7 do
    begin
      LineTo(i * 10, Offset - Points[i] * 2);
      //Кружок для точки
      Ellipse(i * 10 - 2, Offset - Points[i] * 2 - 2, i * 10 + 3, Offset - Points[i] * 2 + 3);
    end;
  end;
end;
Didn't find what you were looking for?
Ask your questionAsk a Question
731 491 924 answers to any question