Answer the question
In order to leave comments, you need to log in
How to make a graph that shows chat activity?
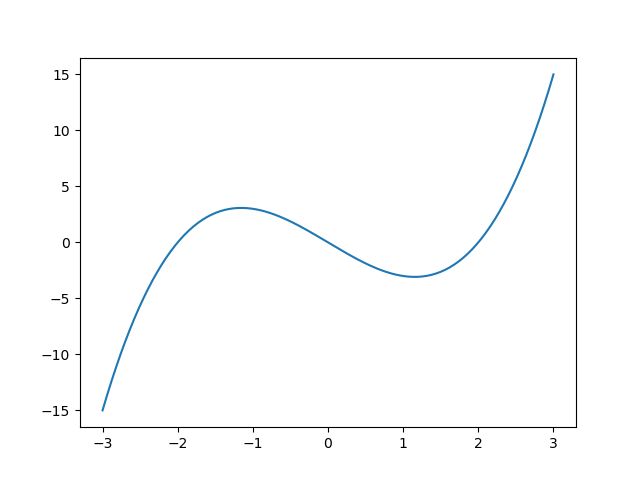
Is it possible to make the graph show information about the activity of the conversation (number of messages)? Now I made an ordinary plot through matplotlib and made it save to a folder for later output to the conversation.
Here is the script:
if msg == "!график":
  x = np.linspace(-3, 3, 200)
  y = x*(x + 2)*(x - 2)
  fig, ax = plt.subplots()
  ax.plot(x, y)
  fig.savefig('график.png')
Answer the question
In order to leave comments, you need to log in
Yes, you can. Take the VK API (if we are talking about VKontakte), use the messages.getHistory method, get all messages, group them by date, count the number of messages in {second, minute, hour, day, month, year}.
For new messages, you can use long poll. If we are talking about a bot, then callback
Personally, I would do this: (Do not take my example, I'm a teapot. Maybe experts will suggest a better solution)
1. For new messages, I would enter the date, message id and user_id (so that you can look at the activity a specific user) to some database
2. Displayed using matplotlib
Didn't find what you were looking for?
Ask your questionAsk a Question
731 491 924 answers to any question