Answer the question
In order to leave comments, you need to log in
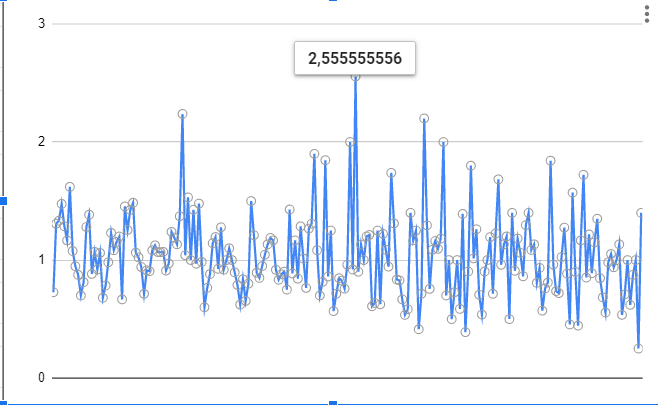
How to make a chart like this in google sheets?

I have such a schedule. I want to add time at the bottom under each mark of the graph. Ideally the date. I must say right away that it is necessary to mark the time every hour, and the days here, respectively, are somewhere less than 10 (you need to indicate the day 1 time for 24 points, and the time will repeat (00:00, 01:00, 02:00 .. .23:00...00:00,01:00) When I add dates to a chart or time, I get nonsense
Answer the question
In order to leave comments, you need to log in
Didn't find what you were looking for?
Ask your questionAsk a Question
731 491 924 answers to any question