Answer the question
In order to leave comments, you need to log in
How to implement a gauge with an arrow in Qt designer?
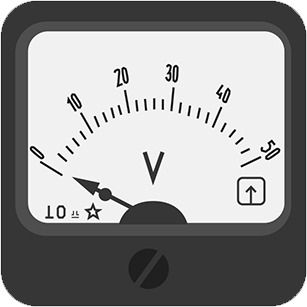
It is necessary to make sure that the device shows the values in a "mechanical" way, not on the LCD screen or textedit, but it draws the indications that it should use with an arrow.
There was an option to somehow add a picture (pixmap) in the form of an arrow itself, and rotate it, but some kind of such an idea.
Now I’m thinking of doing something through Qpainter, but I still can’t find enough relevant information
Who worked with pyqt and Qt designer and was doing something similar can you help with advice or some kind of micro-solution?
There is a drawn device:

I think we need to create a separate widget for it, and then put it into the main form, am I right?
Answer the question
In order to leave comments, you need to log in
Draw your voltmeter in SVG, in some graphics editor
like Inkscape.
Then you do something like this:
import sys
from PyQt5.QtCore import Qt
from PyQt5.QtWidgets import QApplication, QGridLayout, QSlider, QWidget
from PyQt5.QtSvg import QSvgWidget

# потом <g transform="rotate({} 149 239)"> вместо {} подставляем поворот svg_str.format('угол')

svg_str = """<?xml version="1.0" encoding="UTF-8" standalone="no"?>
<svg width="300" height="300" viewBox="0 0 300 300" id="smile" version="1.1">
       <g transform="rotate({} 149 239)">
       <path
       id="path3709"
       style="fill:#ffaaaa"
       d="m 139.42058,223.21182 c 0.87131,-14.42535 -4.24928,-28.50419 -2.9033,-42.95942 0.48305,-19.46355 -1.22008,-39.07505 1.373,-58.42743 1.6052,
       -8.94222 4.9895,-17.45415 6.16399,-26.504939 1.01772,-7.086915 3.62587,-13.774342 5.77506,-20.51875 -0.66844,-6.151843 7.18967,-17.418207 12.67961,
       -11.676647 0.95503,7.682153 2.02107,15.331586 1.83789,23.120357 -0.33324,15.262759 4.70165,29.992469 4.90459,45.223769 1.63015,7.39779 4.63818,
       14.62777 3.86823,22.358 0.53553,10.04962 1.0294,20.61631 -3.7416,29.84285 -4.14927,9.74091 -10.65255,18.64536 -12.38767,29.28844 2.6986,7.78269 16.15108,
       2.57929 17.73005,12.21779 4.03312,10.37811 -0.18518,23.79596 -10.23781,29.07756 -7.18928,5.23203 -18.32381,7.8453 -25.2464,0.73107 -7.03162,
       -6.32331 -14.32459,-14.01261 -14.14214,-24.16516 -1.81894,-9.77467 8.70717,-14.9605 16.7892,-16.15672 3.57541,-1.44912 11.05229,0.60824 4.21681,
       3.35074 -3.55116,4.38962 -14.95304,3.44507 -16.39528,3.56979 3.20643,-0.98242 9.77158,-6.97143 5.3999,-0.45377 -1.78849,9.88387 3.2561,
       19.49489 10.74511,25.66411 4.71707,6.23276 13.94834,7.51007 20.02775,4.68256 -3.55814,1.65986 -11.33056,7.06102 -4.50259,1.28568 5.4695,
       -7.14418 7.51638,-18.29409 1.6675,-25.78616 -6.14571,-3.96281 -20.63622,-3.00294 -14.81272,-14.47468 4.44453,-14.02342 15.463,-25.87651 15.69919,
       -41.19539 -0.0512,-10.63367 0.3575,-21.63757 -3.59197,-31.73103 -1.7771,-9.93749 -1.54095,-20.12739 -3.75043,-30.01069 -1.90453,-11.483749 -1.62159,
       -23.186685 -2.8041,-34.711619 -3.81963,-5.549256 2.88463,-14.540184 7.44473,-11.98753 -1.26415,10.384778 -6.79308,19.654848 -7.94853,30.11085 -1.24183,
       11.198529 -6.6712,21.552179 -6.71927,32.945869 -0.93022,16.32705 0.13083,32.69954 -0.40451,49.04457 -0.31902,11.27313 1.05757,22.49297 2.69956,
       33.56835 3.45207,8.6394 -2.57318,11.85467 -9.43385,14.67758 z"
       />
       </g>
</svg>
"""


app = QApplication(sys.argv)

layout = QGridLayout()    # планировка
widget = QWidget()
widget.setLayout(layout)

svgWidget = QSvgWidget() # SVG виджет
svg_bytes = bytearray(svg_str.format('0'), encoding='utf-8') # подставить угол и перевести в байтовую строку
svgWidget.renderer().load(svg_bytes)  # загрузить SVG в виджет
svgWidget.setGeometry(100,100,300,300)
layout.addWidget(svgWidget)

slider = QSlider(Qt.Horizontal) # слайдер
slider.setRange(-50, 50)

def updateSVG(value):
    """ Обновляет SVG при движении слайдера"""
    svg_bytes = bytearray(svg_str.format(str(value)), encoding='utf-8') # обновить угол и перевести в байтовую строку
    svgWidget.renderer().load(svg_bytes)  # загрузить SVG в виджет

slider.valueChanged.connect(updateSVG)

layout.addWidget(slider)

widget.show()

sys.exit(app.exec_())Didn't find what you were looking for?
Ask your questionAsk a Question
731 491 924 answers to any question